 Clwyd Probert
The Marketing Co-Pilot Operating Model: Scan, Co-Pilot, Scale
The Marketing Co-Pilot Operating Model is a three-stage framework for running AI-assisted marketing: Scan (research, listening and persona intake),...
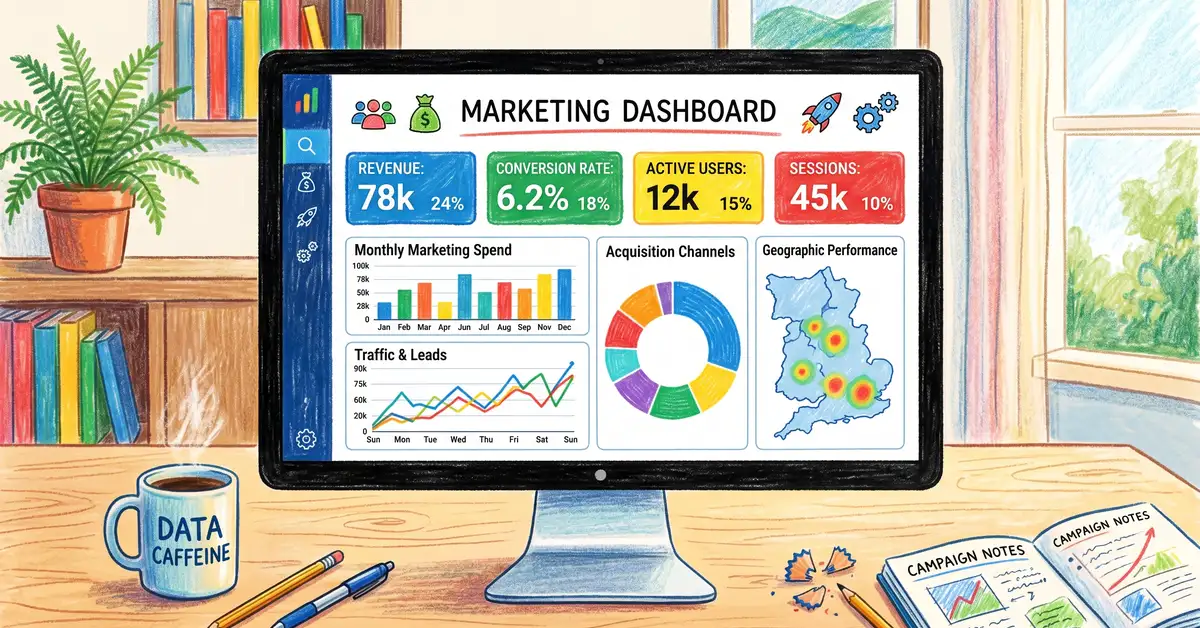
A marketing dashboard is a unified visual interface that consolidates campaign, channel, and customer performance data from multiple platforms into a single real-time view, replacing the fragmented reporting that costs marketing teams 8–12 hours per week in manual data reconciliation. Marketing Mary's research across UK SME marketing operations shows that teams using professional dashboards identify underperforming campaigns 2–3 weeks faster than those relying on platform-native reporting — translating directly into reduced budget waste and faster optimisation cycles.
Key Takeaway
Nearly 70% of marketing leaders struggle to measure campaign ROI, and two-thirds cannot demonstrate marketing impact to stakeholders. A well-built marketing dashboard eliminates this measurement gap by unifying data across your entire stack — turning fragmented numbers into decisions that drive pipeline and revenue.
A marketing dashboard is an interactive reporting interface that pulls key metrics from your advertising platforms (Google Ads, Meta, LinkedIn), CRM system (HubSpot, Salesforce), email marketing tools, and web analytics into one consolidated view. Rather than toggling between a dozen platform-native reports and manually assembling spreadsheet summaries, a dashboard gives your team a single source of truth for marketing performance — updated automatically and accessible on demand.
The business case is straightforward: data fragmentation creates measurement dysfunction. Marketing spend typically represents one of the largest cost categories for growth-stage companies, yet that spend gets scattered across search advertising, paid social, email, content, and organic search. Without unified visibility, you risk investing heavily in underperforming channels while under-resourcing your best performers.
The research evidence on this gap is striking. According to Saras Analytics (2025), nearly 70% of marketing leaders describe measuring campaign ROI as difficult, and only 34% consistently track ROI across all campaigns. This attribution blindness directly slows budget approval cycles and delays optimisation decisions by weeks — compounding inefficiency quarter after quarter.
Professional dashboards solve this in three ways. First, daily performance visibility replaces weekly reporting cycles, enabling rapid campaign adjustments before significant spend leakage occurs. A campaign underperforming by 40% against benchmarks might waste £5,000–£10,000 before a weekly report surfaces the issue; real-time dashboards flag the same problem within hours. Second, dashboards establish a single source of truth, eliminating the cross-team disagreements that plague organisations lacking unified reporting. Third, dashboards transform raw metrics into visual narratives that non-technical stakeholders — finance executives, board members — can interpret immediately.
70%
Leaders Struggle
Cannot measure campaign ROI effectively
80%
Time Saved
Automated dashboards vs manual reporting
34%
Track ROI
Consistently across all campaigns
£1.18B
UK BI Market
2025 valuation, growing to £1.33B in 2026
Sources: Saras Analytics 2025, DataSlayer 2025, Mordor Intelligence 2025
Marketing dashboards function effectively only when populated with the correct metrics — defined consistently, calculated accurately, and benchmarked against industry standards. The distinction between actionable and vanity metrics is whether a change in that metric triggers a specific operational decision. If you cannot articulate the decision you would make if a metric moved 20% in either direction, that metric belongs in an analytics workbench, not on your executive dashboard.
For B2B SaaS and mid-market companies, the essential KPIs fall into four categories: acquisition, engagement, revenue, and attribution. Here are the metrics that should appear on every marketing dashboard, with current 2025–2026 benchmarks.
| KPI | Formula | 2025–26 Benchmark | Why It Matters |
|---|---|---|---|
| CAC | Total acquisition spend ÷ new customers | £239 avg B2B SaaS | Determines unit economics sustainability |
| LTV:CAC Ratio | Customer lifetime value ÷ CAC | 3:1 minimum, 3–5:1 healthy | Fundamental growth health indicator |
| ROAS | Revenue from ads ÷ ad spend | 4:1 healthy, 5:1+ excellent | Channel profitability at a glance |
| MQL→SQL Rate | (SQLs ÷ MQLs) × 100 | 13–21% B2B SaaS | Sales-marketing alignment quality |
| Pipeline Velocity | (Opps × deal value × win rate) ÷ cycle days | £2,134/day at 30–45d cycle | Revenue generation speed |
| CTR | (Clicks ÷ impressions) × 100 | 3–6% Google Search, 1.5% social | Ad relevance and creative quality |
| Churn Rate | (Customers lost ÷ customers at start) × 100 | 2.8–5.7% monthly (by stage) | Revenue retention health |
| Conversion Rate | (Conversions ÷ visits) × 100 | 2.5–3.0% global avg | Website and funnel effectiveness |
Sources: HubSpot 2025, First Page Sage 2026, Understory 2026
A critical anti-pattern to avoid: loading dashboards with vanity metrics that look impressive but fail to connect to business decisions. Metrics like social media follower growth, raw traffic volume, or email open rates provide no information about whether activity translates to qualified leads, pipeline, or revenue. According to Progress (2025), the most common dashboard mistake is displaying metrics without connecting them to revenue outcomes or customer value. Focus on metrics where a 20% swing triggers a specific operational action.
For a comprehensive reference covering 50+ marketing KPIs with calculation formulas and benchmarks, download our free Marketing KPI Dictionary PDF below.
Marketing dashboard templates come in three primary formats, each suited to different technical skill levels, budgets, and data environments. The right choice depends on where your data lives, how technical your team is, and whether you need real-time updates or periodic snapshots.
Google Looker Studio
Free with 1,000+ data connectors. Best for teams using Google Ads, GA4, and Google Sheets. Drag-and-drop interface, live data connections, shareable dashboards. Limited to 5-source blending and basic calculated fields.
Excel / Google Sheets
Zero cost with unlimited customisation. Ideal for teams needing complex calculations, custom formulas, and full analytical flexibility. Requires manual data imports and breaks down beyond 100K rows. No live data without third-party connectors.
HubSpot Native
Built into HubSpot Professional+. Unifies marketing activity with sales pipeline and revenue attribution natively. Pre-built templates for common use cases. Limited when data originates from non-HubSpot systems. Starts at ~£800/month.
According to Graphed (2025), the maturity trajectory follows a predictable pattern. Most teams start with platform-native reporting (Google Ads Manager, Meta Ads Manager), progress to manual spreadsheet consolidation, then graduate to professional dashboard platforms that establish live data connections and automated refresh schedules. The most advanced teams overlay AI-powered anomaly detection and natural language querying on top of their dashboards — a capability Marketing Mary's AI automation platform is designed to deliver.

Choosing the right platform depends on your data ecosystem, team technical skills, and budget. Here is a head-to-head comparison of the primary platforms available to mid-market marketing teams, based on Graphed's 2025 analysis and Coefficient's 2026 BI comparison.
| Platform | Cost | Data Freshness | Learning Curve | Best For | Key Limitation |
|---|---|---|---|---|---|
| Looker Studio | Free–£9/user/yr | Hourly–Daily | Very Low | Google ecosystem, SMEs | 5-source blending limit |
| Excel/Sheets | £0 | Manual | Moderate | Deep analysis, custom calcs | No live data, poor scale |
| HubSpot | £800+/mo | Real-time | Low | CRM-centric B2B SaaS | Non-HubSpot data complexity |
| Power BI | £10–£20/user/mo | Near-real-time | High | Microsoft-centric orgs | Complex setup required |
| Tableau | £12–£25/user/mo | Near-real-time | High | Visual storytelling | Requires BI expertise |
| Databox | £300–£500/mo | Real-time | Low | Marketing-focused teams | Limited custom calculations |
Sources: Graphed 2025, Coefficient 2026, HubSpot Product Catalog 2025
For SMEs running primarily on Google Ads and GA4, start with Looker Studio — you will gain dashboard capability within days at zero cost. If HubSpot is your primary CRM, leverage native reporting first to capture the pipeline attribution that independent platforms require manual integration work to achieve. If you have 15+ data sources and complex cross-platform analysis needs, evaluate specialised marketing analytics platforms like Databox or Improvado before committing to enterprise BI infrastructure.
The key principle: start simple, prove value, then scale. A Looker Studio dashboard built in a week delivers more value than a Tableau implementation stuck in a six-month requirements phase.
Struggling to unify data across 12+ marketing tools? See how Marketing Mary's stack unification creates one source of truth for your dashboards.
See Stack UnificationMarketing Mary provides free, ready-to-use dashboard templates in multiple formats so you can start tracking KPIs immediately — regardless of your technical skill level or platform preference. Each template includes the essential marketing KPIs covered in this guide, pre-built with formulas, conditional formatting, and benchmark references.
Excel Dashboard Template
Pre-built workbook with KPI tracking sheets, automated formulas, conditional formatting, and embedded charts. Ideal for teams who prefer offline access, deep custom calculations, or environments where cloud tools require IT approval. Works in Excel and Google Sheets.
Marketing KPI Dictionary (PDF)
Comprehensive reference covering 50+ marketing KPIs with calculation formulas, benchmark ranges by industry, and guidance on which metrics matter at each funnel stage. Print it, share it with your team, or keep it as a desk reference alongside your dashboard.
HubSpot Dashboard Setup Guide
Step-by-step walkthrough for building a marketing performance dashboard using HubSpot's native reporting. Covers report creation, dashboard assembly, filter configuration, and sharing with stakeholders. Requires HubSpot Professional or higher.
No email required — instant download. Both templates are free to use and customise for your team.
Abstract dashboard advice only becomes useful when you see how real organisations structure their reporting. Here are three dashboard architectures that Marketing Mary's research identified as particularly effective for mid-market teams.
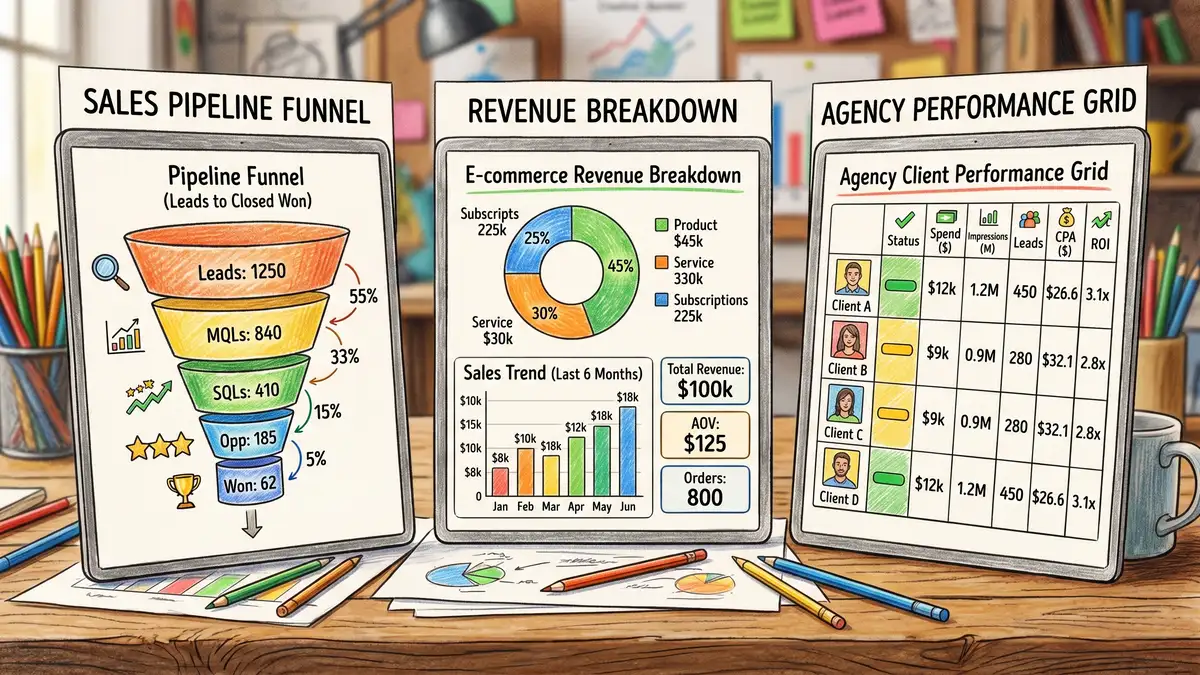
B2B SaaS Pipeline Dashboard
Three tiers: Top — acquisition (leads by channel, CPL trend, lead quality). Middle — conversion (MQL→SQL, SQL→opportunity, opportunity→close rates). Bottom — revenue impact (marketing-influenced pipeline by source, CAC, LTV). Integrates Google Ads, LinkedIn, email platform, GA4, and CRM data to answer: "Which channels deliver customers with highest lifetime value?"
E-Commerce Performance Dashboard
Structured around the transactional funnel. Top — profitability (revenue, AOV, gross margin, marketing spend as % of revenue). Middle — channel ROAS, cost-per-order, contribution to total revenue. Bottom — customer cohort analysis revealing which channels produce highest repeat purchase rates and lifetime value. Enables rapid identification of channel underperformance and product-channel misalignment.
The third architecture — the agency reporting dashboard — is particularly relevant for teams managing multiple client accounts or business units. According to Adriel (2025), agencies managing 15+ clients use unified dashboards that aggregate all accounts into a portfolio view (total spend, blended ROAS, blended CPA), with drill-down into individual client performance against their specific targets. Client login portals let each client see only their own data, eliminating the manual report distribution overhead that consumes 15–23 hours per week per strategist.
The common thread across all three examples: each dashboard follows the inverted pyramid structure. Status and targets at the top ("Are we on track?"), trends and comparisons in the middle ("What is changing?"), and drill-down details at the bottom ("Why, and what do we do about it?"). This mirrors the Z-pattern reading behaviour identified in DataCamp's 2024 dashboard design research — critical KPIs in top-left and top-right positions, supporting detail below.
Building a dashboard is only half the work — maintaining it determines whether it delivers lasting value or joins the "dashboard graveyard" where 30%+ of created reporting becomes inactive within six months. According to Sigma Computing (2025), dashboard maintenance typically costs 15–20% of initial development annually, and organisations that treat dashboards as set-and-forget infrastructure consistently underperform those with disciplined governance practices.
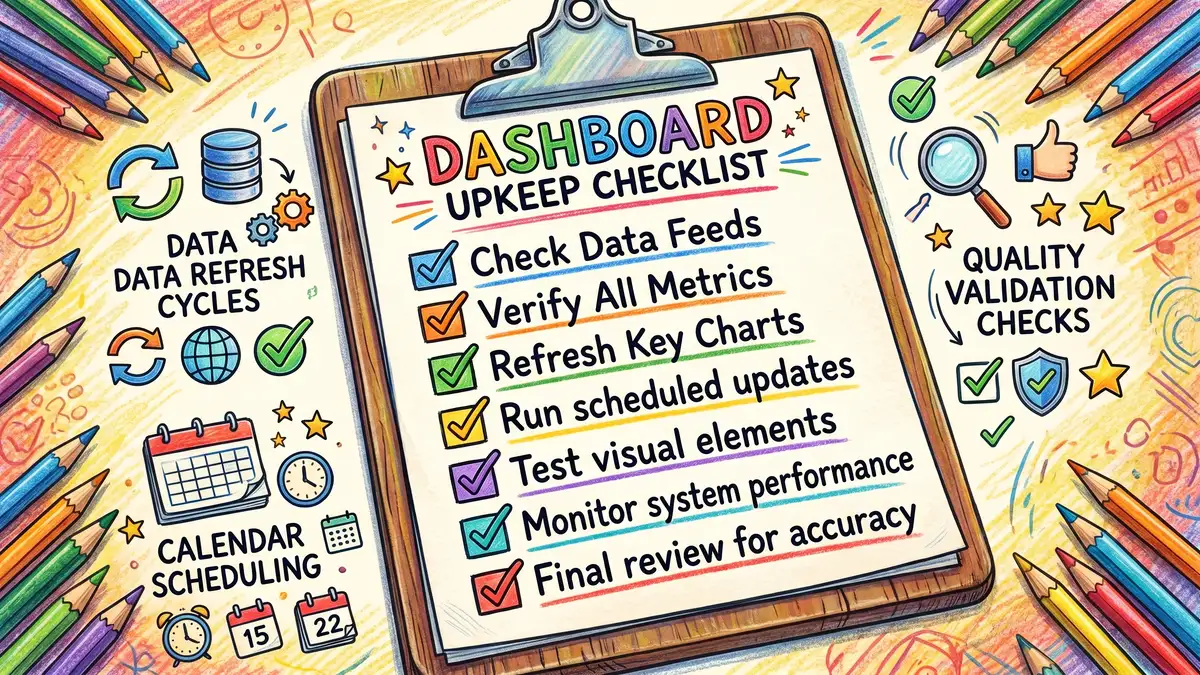
Effective dashboard maintenance requires four practices. First, establish consistent metric definitions in a shared document specifying precisely how each KPI is calculated — CAC including all fully-loaded acquisition costs, ROAS on attributed revenue only, churn as dollar churn rather than logo churn. When different teams apply different calculations, conflicting assessments of channel efficiency emerge, eroding trust in reporting.
Second, implement quarterly KPI audits where stakeholders assess each dashboard and metric against current business objectives. Tag each metric by business value (critical, important, exploratory), ownership (assigned to a specific person), and usage frequency. Metrics tagged "exploratory" or "rarely used" are candidates for retirement. This prevents dashboard proliferation — the gradual accumulation of dozens of reports that nobody reviews.
Third, embed automated data quality validation directly into your dashboard infrastructure. This means red alerts when data is more than 24 hours old, anomaly detection flagging metrics that deviate more than 30% from normal ranges, and completeness checks alerting when expected data sources fail to report. A dashboard displaying Google Ads spend should also display a last-updated timestamp and flag any day with zero spend as "Possible Missing Data" requiring investigation.
Fourth, display data freshness timestamps prominently on every dashboard. Viewers must know whether they are looking at data from five minutes ago (real-time) or five hours ago (potentially stale). This single practice prevents the most insidious dashboard risk: business decisions based on silently incorrect or outdated data.
The Dashboard Graveyard Trap
Common mistake: Building dashboards to answer specific one-time questions rather than support recurring decisions. Teams create 20+ dashboards over 12 months, each answering a narrow question, then abandon most of them within weeks.
The reality: Every dashboard requires ongoing maintenance — data source updates, metric recalibration, stakeholder training. Before creating a new dashboard, ask: "Will someone open this every week to make a specific decision?" If not, use an ad-hoc analysis instead.
Marketing dashboards are transitioning from static reporting infrastructure to intelligent systems where artificial intelligence enables autonomous anomaly detection, predictive forecasting, and natural language interaction. According to Mordor Intelligence (2025), 31% of UK SMEs are actively using AI tools for marketing and analytics, with another 15% planning adoption within 12 months — signalling accelerating demand for AI-powered dashboards.
Three AI capabilities are moving from experimental to mainstream in 2025–2026. Anomaly detection algorithms learn your campaign's typical performance pattern, then automatically flag deviations exceeding defined thresholds. A campaign typically generating 50 conversions daily that suddenly generates only 25 triggers an alert — enabling rapid investigation before significant budget waste accumulates. Organisations implementing anomaly detection identify performance issues 2–3 weeks earlier than manual weekly review processes.
Predictive performance forecasting leverages historical campaign data to estimate likely outcomes before campaigns complete. AI models trained on 12+ months of data identify patterns correlating with success, providing confidence-rated forecasts ("estimated ROAS 3.2:1, 87% confidence") that enable pre-campaign decisions about target achievement and budget levels.
Natural language querying removes the need for dashboard platform expertise or SQL knowledge. Instead of navigating menus, marketers ask questions: "Which campaigns have highest risk of underperforming this month?" or "Which product categories show declining lifetime value?" Pilot implementations in Power BI and Tableau have reduced dashboard creation time by 60%, democratising analytics access beyond technical specialists.
For UK SMEs specifically, the convergence of three factors creates opportunity now: proven productivity benefits from analytics infrastructure (5–15% efficiency improvements within 12 months), SaaS adoption expanding at 34% annually removing capital expenditure barriers, and AI-powered analytics democratising data access. Marketing Mary's AI marketing agent is designed to bring these capabilities — anomaly detection, predictive metrics, and natural language querying — directly into your existing dashboard workflow, without requiring enterprise-grade BI infrastructure. Learn more about how AI transforms marketing operations in our content strategy guide.
The Bottom Line
Start with a simple dashboard that tracks 5–8 decision-critical KPIs, prove its value with faster optimisation cycles and clearer stakeholder reporting, then scale your analytics infrastructure as your team matures. The most costly dashboard failure is building technically sophisticated reporting that provides information without supporting decisions.
A basic marketing dashboard in Google Looker Studio or Excel takes 2–5 days to build, including data connection setup and initial chart configuration. A comprehensive dashboard integrating 5+ data sources with custom calculated metrics typically requires 2–4 weeks. Enterprise implementations using Power BI or Tableau with complex data modelling stretch to 3–6 months. Start simple with your highest-priority KPIs and iterate.
Google Looker Studio is the most capable free marketing dashboard tool available in 2025–2026. It connects to 1,000+ data sources including Google Ads, GA4, Facebook, LinkedIn, and HubSpot, offers drag-and-drop chart building, and supports permission-based sharing. The free tier handles most SME reporting needs. For teams requiring deeper analytical flexibility with formulas and custom calculations, Google Sheets remains a strong free alternative.
Dashboard refresh frequency depends on the decisions it supports. Active campaign monitoring dashboards should refresh daily at minimum — hourly for real-time budget optimisation. Strategic performance dashboards reviewed in weekly or monthly executive meetings can refresh daily without issue. The critical practice is displaying data freshness timestamps on every dashboard so viewers know whether data is five minutes or five hours old.
CEO-level marketing dashboards should display five to seven metrics: marketing-attributed revenue, customer acquisition cost (CAC), LTV:CAC ratio, marketing-influenced pipeline value, return on ad spend (ROAS), and conversion rate by channel. Avoid operational detail like individual campaign CTR or email open rates — those belong on team-level dashboards. Focus on metrics that answer "Is marketing driving profitable growth?"
Before creating any dashboard, identify the specific recurring decision it will support. If no one can articulate a weekly decision the dashboard enables, build an ad-hoc analysis instead. Assign an owner responsible for maintenance and metric accuracy. Run quarterly KPI audits to retire unused dashboards — research shows over 30% of dashboards become inactive within six months. A dashboard that three people use weekly outperforms one that twenty people admired once.
Ready to Turn Your Marketing Data Into Decisions?
Marketing Mary's AI Co-Pilot unifies your marketing stack, tracks KPIs automatically, and surfaces anomalies before they drain your budget — so your team spends time optimising, not reporting.
Clwyd Probert
Founder, Marketing Mary
Clwyd Probert is the founder of Marketing Mary, an AI-powered marketing co-pilot platform, and CEO of Whitehat, a London-based SEO and inbound marketing agency and HubSpot Platinum Partner since 2016.
Sources: Saras Analytics 2025, DataSlayer 2025, Graphed 2025, DataCamp 2024, HubSpot 2025, First Page Sage 2026, Mordor Intelligence 2025, Adriel 2025, Sigma Computing 2025

The Marketing Co-Pilot Operating Model is a three-stage framework for running AI-assisted marketing: Scan (research, listening and persona intake),...

How to Run a MarTech Stack Audit: Framework, Scoring Template, and ROI Calculator A MarTech stack audit systematically evaluates every marketing...

A buyer persona tool is software that builds, stores, and operationalises research-based profiles of your ideal customers — the goals, pains, and...

1 min read
Key Takeaway Marketing teams spend 20–60 hours per month on reporting — nearly half on formatting and commentary that adds no analytical value. The...
1 min read
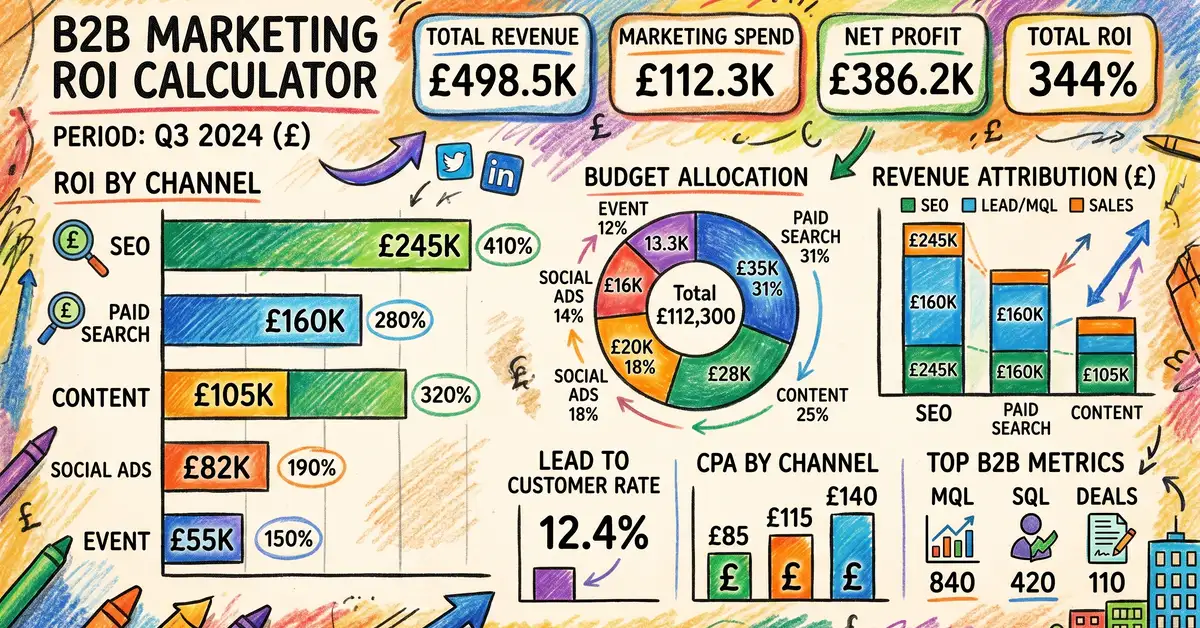
A marketing ROI calculator takes your channel spend, revenue generated, and associated costs — then outputs the true return percentage, cost per...

1 min read
Why You Need a Marketing Plan Template A marketing plan template gives your team a proven structure that turns scattered ideas into a focused,...