
What is an evidence-graded buyer persona?
 Clwyd Probert: Sep 30, 2026, 8:25:00 PM
An evidence-graded buyer persona is a buyer persona in which every claim carries a label saying where it came from: first-party evidence (the...

A MarTech stack audit systematically evaluates every marketing technology tool against five dimensions — integration quality, feature utilization, cost efficiency, security compliance, and strategic alignment — to identify waste, redundancy, and consolidation opportunities. This audit framework helps B2B teams work through large stacks and find the budget lost to underused or duplicate tools. The structured approach below, paired with a downloadable scoring template, delivers actionable findings within two weeks rather than months of ad hoc investigation.
Key Takeaway
Marketing teams use only about a third of their martech stack's capability: 33% in 2023, down from 58% in 2020, according to Gartner. A structured MarTech audit shows which tools, and how much spend, aren't earning their place.
33%
Martech Capability Used
Down from 58% in 2020 (Gartner)
Source: Gartner Marketing Technology Survey 2023
A MarTech stack audit is a structured evaluation of every marketing technology tool your organization uses, scored against quantifiable criteria to identify waste, redundancy, integration failures, and consolidation opportunities. Unlike ad hoc tool reviews that focus on individual platforms, a comprehensive audit evaluates your entire ecosystem as an interconnected system where each tool's value depends on how well it connects with the rest of your stack.
The audit matters because tool proliferation has outpaced most teams' ability to manage their stack effectively. Marketing technology budgets keep growing, yet much of that investment goes underused. The problem compounds annually — each new tool adds integration complexity, training overhead, and administrative burden that drains marketing operations capacity from strategic work into firefighting.
Our MarTech stack guide covers the full landscape of tool categories and selection criteria. This audit framework picks up where selection ends — evaluating whether your existing tools still earn their place in your stack, and providing the evidence base for consolidation decisions that recover wasted spend.

The five-dimension framework scores every tool across five dimensions that collectively determine whether a platform earns retention, requires remediation, or warrants replacement. Each dimension uses a 1-5 scale with explicit criteria, eliminating subjective judgment and ensuring consistent evaluation across your entire stack. The five dimensions are: integration quality, feature utilization, financial efficiency, security and compliance, and strategic alignment.
| Dimension | Weight | What It Measures | Red Flag Threshold |
|---|---|---|---|
| Integration Quality | 25% | API connectivity, data sync reliability, bidirectional flow | Sync reliability below 85% |
| Feature Utilization | 20% | % of features used monthly by 10%+ of users | Below 25% utilization |
| Financial Efficiency | 25% | Total cost of ownership including admin labor | Cost-per-user 2x category average |
| Security & Privacy Compliance | 20% | Privacy-law compliance (GDPR, US state laws), data residency, SOC 2 status | No DPA, or data stored where your privacy obligations don't allow it |
| Strategic Alignment | 10% | Roadmap fit with business direction | Vendor stagnation or acquisition risk |
Source: our framework (weights are our recommendation), adapted from ChiefMartec assessment methodology 2025
Integration quality carries the heaviest weighting because poorly integrated tools generate the highest ongoing costs, mostly in manual work to move and fix data between tools. A tool scoring perfectly on every other dimension but failing on integration still creates operational drag that compounds over time. The audit shows which integrations are draining your team's time, so you can fix or replace them.
A comprehensive MarTech stack audit follows five sequential phases over 10-15 business days. Each phase builds on the previous one, ensuring findings rest on complete data rather than assumptions. The downloadable scoring template turns the audit into a structured process your team can run itself. The audit workbook includes a tool inventory, a 1–5 scoring matrix on four dimensions (utilization, integration, overlap and ROI clarity), a total-cost-of-ownership sheet and a license-savings estimate: the annual license cost of the tools you score for review or removal. Use the weighted five-dimension framework above for the fuller assessment, and estimate labor and integration savings separately using the framework below. Download the MarTech stack audit workbook (Excel).
Discovery and Inventory (Days 1-3)
Document every tool across marketing, including shadow IT purchases. Cross-reference with finance records, SSO logs, and browser extension audits. Record: tool name, annual cost, user count, primary function, deployment date, and contract renewal date.
Stakeholder Assessment (Days 3-5)
Interview 2-3 representatives from each tool-using team using a structured protocol. Capture: features relied upon daily, integration pain points, training gaps, and workflow dependencies. This qualitative data reveals why tools are underused — not just that they are.
Metrics Collection (Days 5-8)
Pull platform usage analytics, integration performance logs, licensing records, and security certifications. Score each tool 1-5 across all five dimensions using the criteria above. Flag any tool lacking a Data Processing Agreement or SOC 2 Type II for immediate security review.
Comparative Evaluation (Days 8-11)
Calculate weighted scores per tool. Identify redundancy clusters (tools serving identical functions). Map integration gaps creating manual work. Generate a priority matrix: retain, remediate, replace, or consolidate for each tool.
Findings and Roadmap (Days 11-15)
Synthesize findings into a prioritized consolidation roadmap with three horizons: immediate wins (0-30 days), medium-term consolidation (3-6 months), and strategic replacement (6-12 months). Include business case with projected savings for finance stakeholder approval.

Stack consolidation ROI derives from three sources: eliminated tool costs, recovered labor capacity, and reduced integration maintenance. The audit workbook estimates the first of these, using the license costs of the tools you score for review or removal; estimate recovered labor capacity and integration maintenance separately. The calculation framework below shows how mid-market organizations typically quantify the business case for consolidation.
Direct savings from tool elimination represent the most visible benefit. Cutting tools cuts annual licensing costs in proportion to what you remove. Deeper cuts are possible but meet user adoption resistance and can sacrifice needed capability. Aim to remove overlap while keeping every capability you need, through better use of the platforms you retain.
Labor capacity recovery represents the hidden multiplier that many audit business cases underestimate. Consolidated stacks reduce the time marketing operations staff spend on tool administration. This recovered capacity redirects your operations team from firefighting broken integrations toward strategic workflow optimization — the work that actually drives revenue impact.
The security and privacy compliance assessment within the MarTech audit evaluates whether each tool maintains appropriate data processing agreements, supports the privacy rights your contacts have under the laws that apply to them, and stores their data where your obligations allow. This dimension functions as a pass/fail gate — tools failing minimum compliance requirements warrant replacement regardless of performance on other dimensions, because non-compliance carries material financial and reputational risk.
If you have US contacts, check the state privacy laws that apply. California's CCPA, as amended by the CPRA, gives consumers the right to know, delete and correct the personal information a business holds about them, to opt out of its sale or sharing, and to limit the use of sensitive personal information; it also requires a contract with the service providers you disclose that information to. Virginia and Colorado are among the other states with their own comprehensive privacy laws. Your audit should confirm each vendor's contract covers those service-provider terms and that the tool can handle access, deletion, correction and opt-out requests.
For UK data (ICO guidance). The Information Commissioner's Office guidance requires organizations acting as data controllers to ensure processors (your tool vendors) maintain technical and organizational measures sufficient to protect personal data. Your audit should verify each tool has: a signed Data Processing Agreement specifying processing purposes and security measures; data residency within UK or EU data centers (or appropriate transfer safeguards for non-adequate jurisdictions); documented mechanisms for fulfilling subject access requests without undue delay and at the latest within one month; and incident notification procedures that let you report a notifiable breach to the ICO within 72 hours of becoming aware of it.
Tools operating on US-only infrastructure without UK adequacy bridge mechanisms represent elevated compliance risk following evolving transatlantic data transfer regulations. Flag tools requiring immediate attention separately from those needing contractual updates at next renewal; the workbook's Notes column is a place to record each tool's status.
This is general information, not legal advice: check how these rules apply to you with your own legal adviser.
Audit findings consistently reveal that certain tool categories harbor disproportionate waste. Understanding these patterns helps teams focus initial audit effort where consolidation opportunities are richest. Analytics, social management and content tools are the categories most likely to overlap, so check those first.
| Category | Overlap Risk | Typical Consolidation Opportunity |
|---|---|---|
| Marketing Automation | Low | Feature activation, not tool replacement |
| Analytics & Reporting | High | Consolidate 3-4 tools to 1-2 platforms |
| Social Management | High | Publishing, listening, and ads often separate |
| Content & DAM | Medium | CMS capabilities often duplicate DAM features |
| ABM & Intent | Medium | Intent signals often available in existing CRM |
Overlap risk is our guidance from the audit framework, not survey data.

Integration quality assessment uses a five-level maturity model that evaluates not just whether tools connect, but how reliably and completely they share data. This dimension carries 25% of the weighting because integration failures cause the most ongoing cost — converting your marketing operations team into full-time data janitors rather than strategic contributors.
| Level | Classification | Definition | Operational Impact |
|---|---|---|---|
| 1 | Isolated | No integration; manual CSV exports | Regular manual transfers |
| 2 | Basic | Middleware (Zapier); batch sync; one-way | Ongoing monitoring and fixes |
| 3 | Intermediate | Native API; automated but with gaps | Occasional manual reconciliation |
| 4 | Advanced | Bidirectional real-time; 95%+ reliability | Minimal manual intervention |
| 5 | Unified | Single data layer; event-driven; zero manual | Full automation; ops team is strategic |
Score each tool's integration against the tools it needs to connect with — not in isolation. A tool at Level 2 with your CRM but Level 4 with your email platform creates inconsistent data across your funnel. Score each connection separately and weight the average by how critical each connection is to your core workflows; the workbook's Integrates With column lists each tool's connections. Tools averaging below Level 3 across critical connections should be flagged for either integration investment or replacement with a better-connected alternative.
The Integration Trap to Avoid
Common mistake: Scoring integration based on whether an API exists, rather than whether it works reliably in your specific configuration.
The reality: Tools that don't integrate well tend to go unused. A vendor's integration page showing 200+ connectors means nothing if your specific data flow breaks weekly. Test actual sync reliability over 30 days before scoring.

Audit findings translate into a three-horizon consolidation roadmap that balances quick wins against longer-term strategic moves. The framework sorts recommendations by implementation complexity and stakeholder approval requirements, ensuring your team can demonstrate momentum with immediate savings whilst building the business case for larger consolidation decisions.
Horizon 1 (0-30 days): Cancel tools scoring below 2.0 weighted average with no active users. Renegotiate contracts approaching renewal where utilization data supports lower tier. Eliminate duplicate tools serving identical functions. These moves need little change management effort.
Horizon 2 (3-6 months): Consolidate redundant tool clusters (e.g., three analytics tools into one). Implement training programs for underutilized features in retained tools. Upgrade integration levels for tools scoring below Level 3 on critical connections. This horizon requires stakeholder coordination; plan for 8-12 weeks per consolidation project.
Horizon 3 (6-12 months): Replace strategic platforms where roadmap misalignment or vendor risk warrants full migration. Implement unified data architecture reducing total integration points. These decisions require executive sponsorship and usually deliver the largest long-term savings; allow 6-9 months for implementation, including data migration and user transition.
Conduct a comprehensive audit annually, with lightweight quarterly reviews checking utilization metrics and contract renewals. Align your comprehensive audit with Q3-Q4 budget planning to ensure findings inform the next fiscal year's technology allocation.
Marketing operations should lead with cross-functional input from finance (cost data), IT (integration and security assessment), and information security (compliance evaluation). The audit requires access to platform analytics, licensing records, and security certifications that typically span multiple departments. A single functional owner avoids the coordination failures that let tools accumulate without oversight.
Flag locked-in tools for contract expiry tracking in the audit template. Document performance evidence now so you have 12-18 months of data supporting either renegotiation or non-renewal. Many vendors will renegotiate mid-contract when presented with utilization evidence showing you're overpaying relative to usage, particularly if you can demonstrate competitive alternatives.
Any organization with 10+ marketing tools benefits from a structured audit. Below 10 tools, informal quarterly reviews usually suffice. Even a smaller stack usually has some overlap worth finding, which justifies the 15 hours the audit process requires.
AI tools warrant additional scrutiny on two dimensions: data handling (where does your proprietary data go when processed by AI models?) and output quality versus cost. Many teams have added several AI tools without evaluating overlap. Apply the same five-dimension framework, but add explicit assessment of training data policies and whether the AI capability could be consolidated into existing platform features rather than standalone tools.
See what Mary finds on your website.
Join the early-adopter list and be one of the first to try Mary on your own website.
Plans from Free to Enterprise · pricing to be confirmed
Sources: ChiefMartec MarTech Landscape 2025, Gartner Marketing Technology Survey 2023, ICO UK GDPR Guidance 2025
 Clwyd Probert: Sep 30, 2026, 8:25:00 PM
An evidence-graded buyer persona is a buyer persona in which every claim carries a label saying where it came from: first-party evidence (the...
 Clwyd Probert: Sep 9, 2026, 11:58:11 PM
Our own Search Console tells this story: impressions up 53% and clicks down 6% in the 28 days to September 6, 2026, compared with the 28 days before,...
 Clwyd Probert: Aug 25, 2026, 10:16:09 AM
You can find HubSpot's credit rates. You can find your monthly allowance. What you cannot easily find is the sentence that connects them — so most...
 Clwyd Probert : Mar 26, 2026, 9:00:00 AM
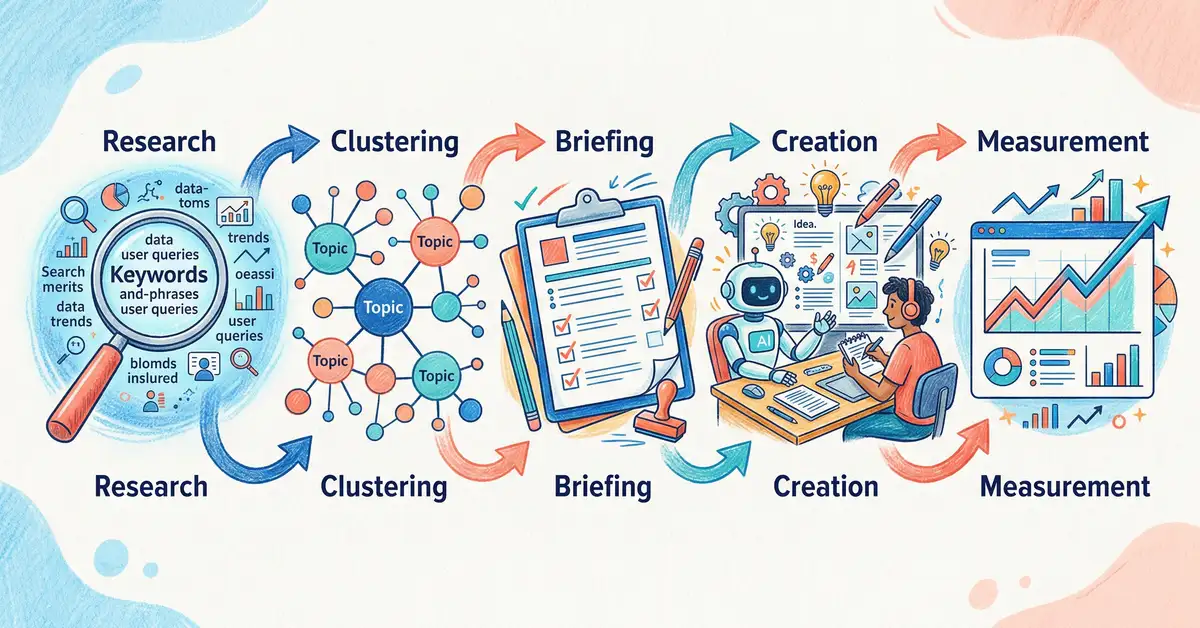
Build an AI content strategy, from research and clustering to briefs, creation and measurement, with a five-stage framework.
 Clwyd Probert : Jul 26, 2026, 5:24:55 PM
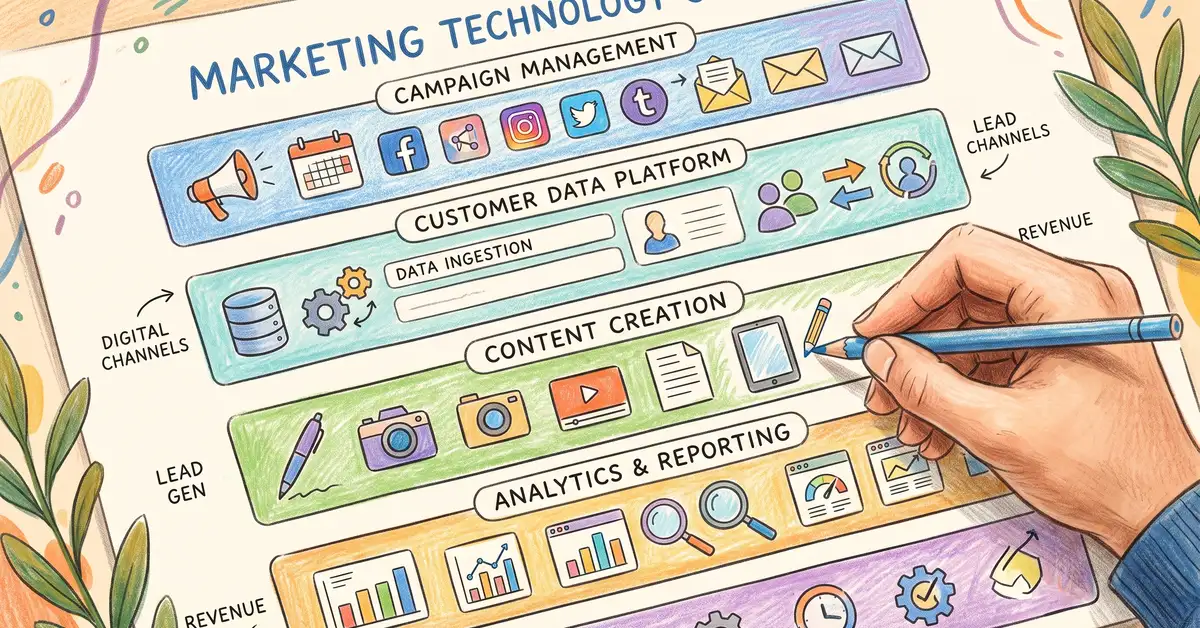
Free editable MarTech stack diagram template in PowerPoint. Map your marketing tools across six layers in 20 minutes and see overlap, gaps and wasted...
 Clwyd Probert : May 3, 2026, 11:00:00 AM
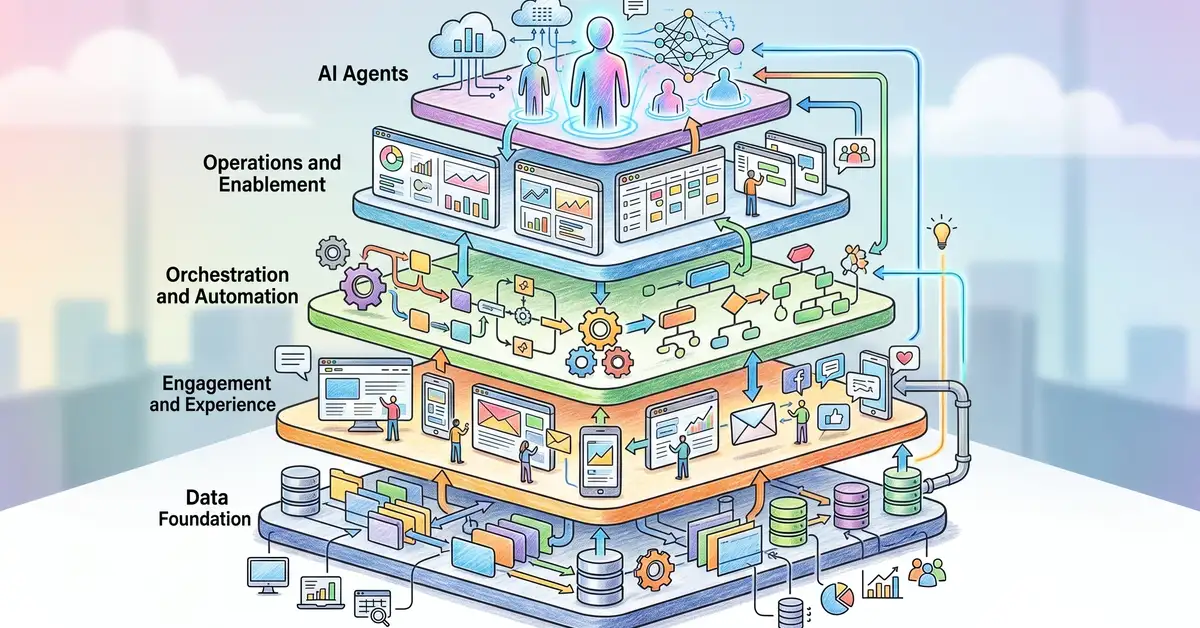
What a MarTech stack is, the 5 core layers, and how suite, best-of-breed and composable setups compare, with cost benchmarks for B2B marketing teams.