 Clwyd Probert
The Marketing Co-Pilot Operating Model: Scan, Co-Pilot, Scale
The Marketing Co-Pilot Operating Model is a three-stage framework for running AI-assisted marketing: Scan (research, listening and persona intake),...
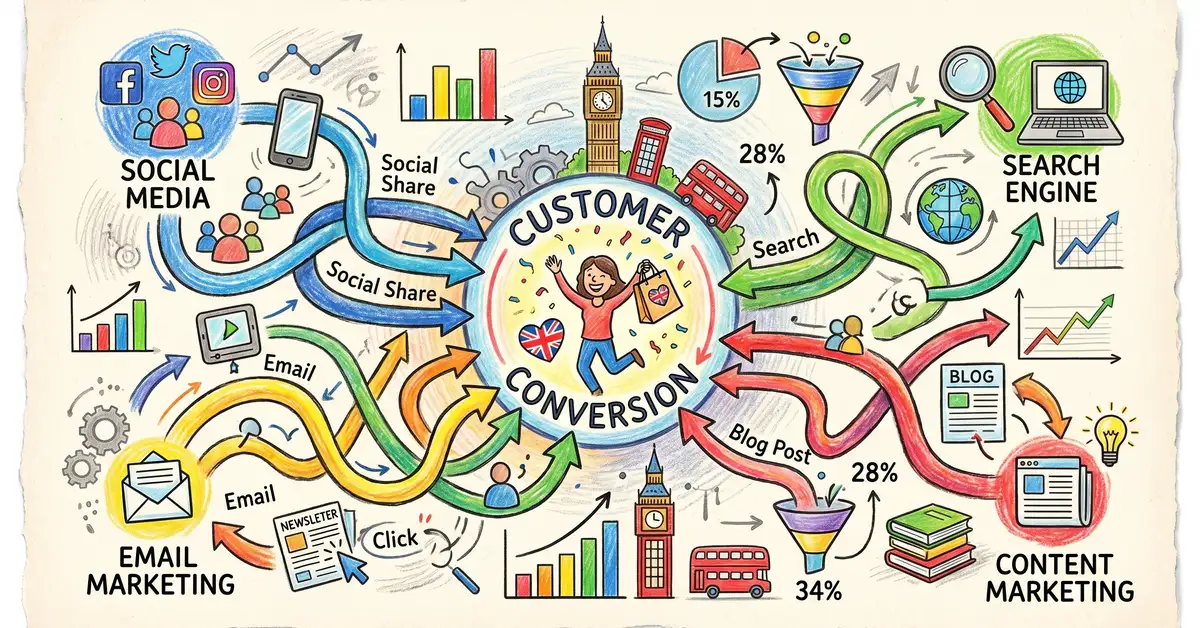
Marketing attribution models determine how credit for conversions gets distributed across every touchpoint in your buyer's journey. If you're spending across six or more channels but can't tell which ones actually drive revenue, you're flying blind — and you're not alone. Only 24% of UK B2B organisations currently use multi-touch attribution, according to Gartner's 2025 UK Digital Marketing Survey, leaving the majority reliant on single-touch models that systematically misallocate budget.
This guide breaks down every major attribution model — first-touch, last-touch, linear, time-decay, position-based, W-shaped, and data-driven — with the formulas, strengths, limitations, and implementation guidance you need to choose the right one for your business. Whether you're running campaigns through multi-channel marketing automation or still reconciling spreadsheets, this is your roadmap to attribution that actually works.
Marketing attribution models matter because they directly control where your budget goes. Without accurate attribution, you're making six-figure decisions based on incomplete data — and the numbers prove it. B2B buyer journeys now involve 6 to 8 touchpoints on average before conversion, with enterprise purchases reaching 10 or more, according to Demand Gen Report's 2024 research. Single-touch models like last-click ignore every touchpoint except one, misattributing credit and distorting your entire channel mix.
The financial impact is substantial. Organisations implementing multi-touch attribution report average budget reallocation of 18% to 22% across channels, with customer acquisition cost (CAC) reductions of 12% to 19% through better channel mix optimisation, according to McKinsey's 2024 Digital Marketing Analysis. For a UK mid-market SaaS firm spending £500K annually on marketing, that's £60K to £95K in recovered budget — money currently wasted on over-credited channels.
The UK attribution gap is particularly stark. UK B2B organisations show 8 to 12 months delayed adoption compared to North American peers. Only 24% of UK mid-market SaaS firms use multi-touch models, primarily because 42% lack a dedicated Marketing Operations hire and 58% cite GDPR compliance concerns as barriers, per Gartner's 2025 data. The opportunity for early movers is significant.
Key Takeaway: Attribution isn't an analytics project — it's a budget allocation project. Every month you rely on single-touch attribution, you're systematically over-investing in "deal closer" channels (paid search, direct) and under-investing in the awareness and nurturing channels (content, email, organic) that create purchase intent in the first place.
First-touch attribution awards 100% of conversion credit to the very first touchpoint a prospect interacts with before converting. If someone discovers your brand through a LinkedIn ad, then engages with five more touchpoints before purchasing, LinkedIn gets all the credit.
The formula is straightforward: first touchpoint receives 100% of conversion value; all subsequent touchpoints receive 0%.
When to use it: First-touch works best for measuring which channels drive initial awareness, particularly during new market entry campaigns or when you're testing new acquisition channels. It answers the question "where do our prospects first discover us?" clearly.
Strengths: Simple to calculate and implement. Highlights awareness-generation channels. Useful for top-of-funnel budget decisions.
Limitations: Completely ignores nurturing efforts. Inflates the value of broad channels like social and display. Undervalues bottom-funnel activity. Inappropriate for B2B sales cycles exceeding 90 days, which covers most mid-market and enterprise deals.
Only 12% of B2B SaaS organisations use first-touch as their primary model, according to Demand Gen Report — and for good reason. In a journey with 7 touchpoints, giving 100% credit to the first one tells you almost nothing about what actually converted the deal.
Last-touch attribution assigns 100% of conversion credit to the final touchpoint before purchase. It was the default model in Universal Analytics for years and remains the most widely used approach — 35% of B2B SaaS organisations still rely on it as their primary model, according to Forrester's 2024 Wave report.
The formula: last touchpoint receives 100% of conversion value; all prior touchpoints receive 0%.
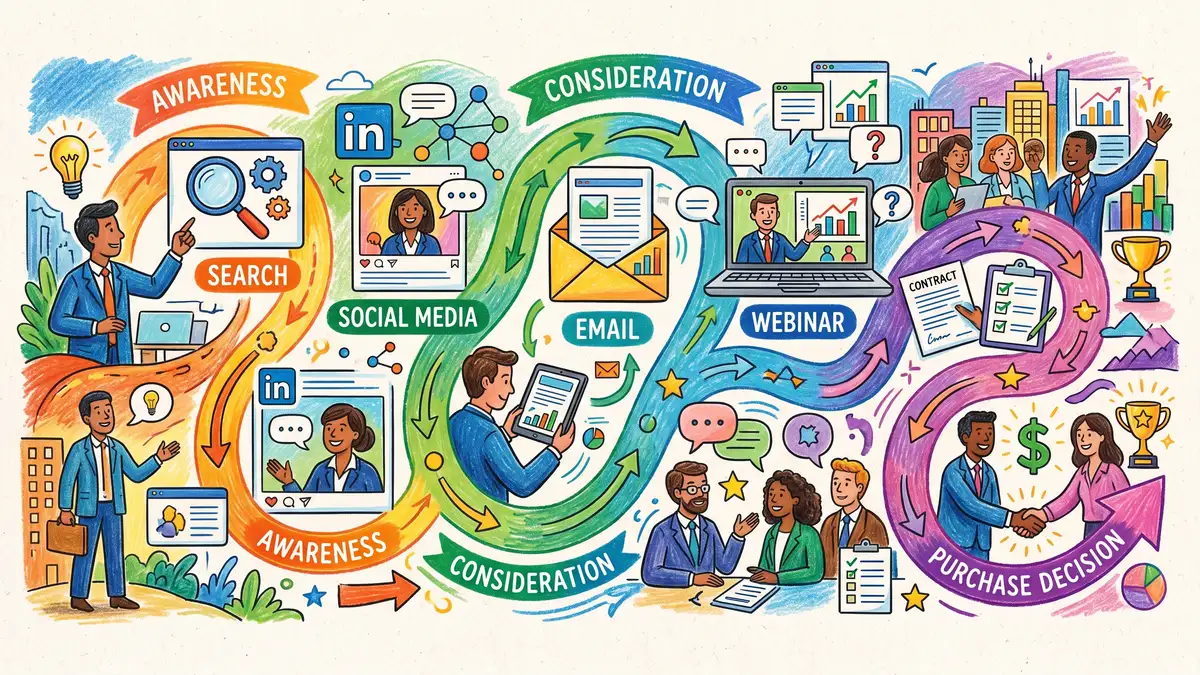
Why it misleads B2B teams: Consider a typical prospect journey. Week 1: LinkedIn article ad creates awareness. Week 2: email campaign drives webinar registration. Week 3: webinar attendance deepens consideration. Week 4: product comparison email moves them to decision stage. Week 5: they navigate directly to your pricing page and submit a form. Last-touch attribution gives 100% credit to "direct traffic" — a generic form submission — while the LinkedIn ad, email sequence, and webinar that created the entire buying journey get zero.
The real-world consequences are damaging. Email marketing represents 28% of B2B touchpoints but receives only 8% of attributed credit under last-touch models, according to Demand Gen Report. This leads to systematic budget cuts in the exact channels that generate pipeline.
The shift away from last-touch is accelerating. Google Analytics 4 deprecated last-click as its primary model in January 2024, switching to data-driven attribution as the default. Yet 42% of UK mid-market B2B firms still exclusively use last-touch attribution despite average journey lengths of 7.8 touchpoints — a disconnect that costs real money.
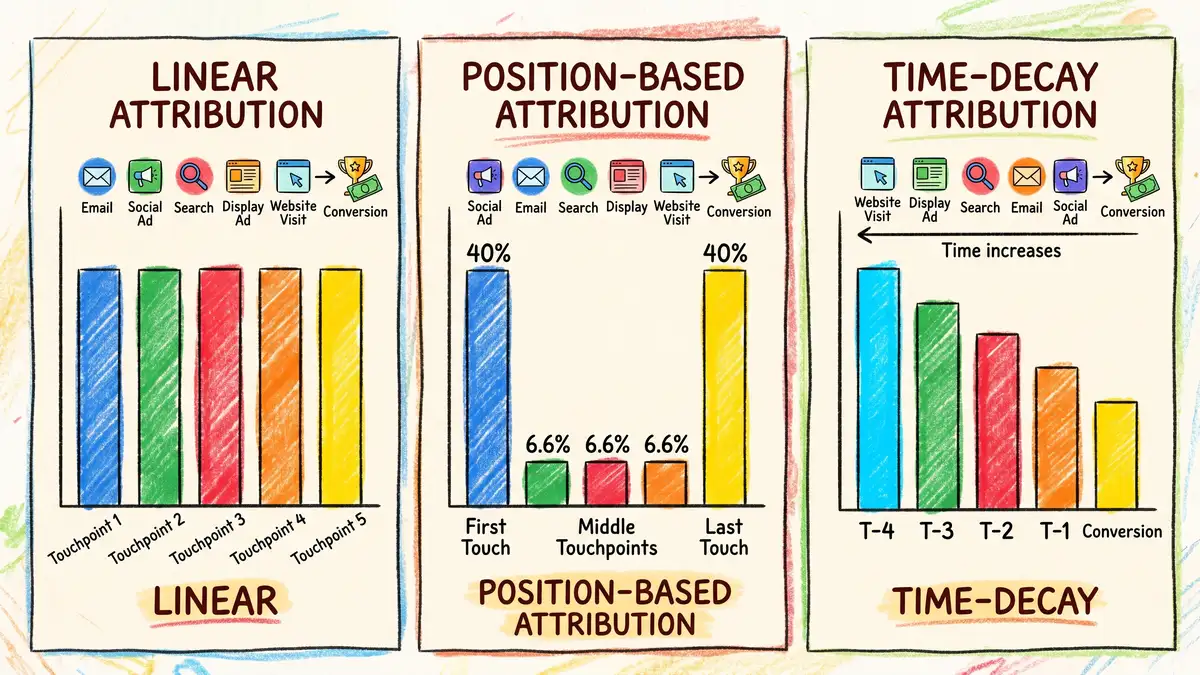
Time-decay attribution assigns progressively higher credit to touchpoints closer to the conversion event. Touchpoints that happened yesterday count more than those from three weeks ago, following an exponential decay curve. This reflects a fundamental truth about B2B buying: interactions closer to the purchase decision carry more weight because they occur when intent is highest.
The formula uses exponential decay: each touchpoint's credit equals the conversion value multiplied by e raised to the power of negative lambda times t, divided by the sum of all such values. In practice, with a 7-day half-life, the conversion-day touchpoint gets roughly 50% credit, the day-before touchpoint gets 25%, two days before gets 12.5%, and earlier touchpoints share the remainder.
When it works well: Time-decay excels for B2B SaaS with 6 to 10 week sales cycles where recent interactions genuinely signal stronger purchase intent. It mathematically honours temporal relevance without completely discounting early-stage awareness.
Limitations: Requires parameter tuning — the "half-life" assumption varies by industry and deal complexity. May undervalue long-running lead nurturing sequences. Can be complex to communicate to stakeholders who want simple answers.
Only 8% of B2B SaaS organisations use time-decay as their primary model, partly because it requires more configuration than single-touch alternatives. However, it's available natively in both Google Analytics 4 and HubSpot Professional editions, making implementation straightforward for teams already on those platforms.
Linear attribution distributes conversion credit equally across every touchpoint in the buyer journey. If a prospect interacts with five touchpoints before converting on a £10,000 deal, each touchpoint receives £2,000 in attributed credit.
The formula: credit per touchpoint equals conversion value divided by total number of touchpoints.
Who benefits: Linear attribution works for organisations where all touchpoints have genuinely similar influence — rare in B2B but possible in short-cycle, high-velocity sales. It's also useful as a baseline comparison when evaluating other models, because it reduces channel bias and acknowledges every marketing activity's contribution.
Strengths: Simple to explain to stakeholders. Reduces the "winner takes all" distortion of single-touch models. Available natively in GA4 and HubSpot. Currently used by 18% of B2B SaaS organisations.
The core limitation: Linear attribution treats a first display ad impression exactly the same as a final negotiation conversation. In B2B journeys spanning 12 to 20 weeks with vastly different touchpoint quality, this equal weighting produces misleading budget signals. A LinkedIn awareness ad simply doesn't carry the same conversion influence as a demo call — yet linear attribution says they do.
Choosing the right attribution model depends on your sales cycle length, touchpoint count, data maturity, and team resources. Here's how the major models stack up across the dimensions that matter most for B2B teams.
First-Touch Attribution. Best for: awareness channel analysis and new market entry. Typical users: 12% of B2B SaaS. Credit distribution: 100% to first touchpoint. Implementation complexity: very low. Data requirements: none beyond basic tracking. Recommended for: short cycles under 4 weeks with 3 to 5 touchpoints.
Last-Touch Attribution. Best for: direct performance measurement and conversion optimisation. Typical users: 35% of B2B SaaS. Credit distribution: 100% to last touchpoint. Implementation complexity: very low. Data requirements: none. Recommended for: self-serve products with short cycles — but actively discouraged for any B2B with 6 or more touchpoints.
Linear Attribution. Best for: balanced full-journey view and baseline comparisons. Typical users: 18% of B2B SaaS. Credit distribution: equal across all touchpoints. Implementation complexity: very low. Data requirements: none. Recommended for: early-stage attribution adoption when you need simplicity.
Time-Decay Attribution. Best for: sales-assisted B2B with 6 to 10 week cycles. Typical users: 8% of B2B SaaS. Credit distribution: exponentially weighted toward recent touchpoints. Implementation complexity: low to medium. Data requirements: conversion window configuration. Recommended for: mid-market SaaS where recent interactions genuinely signal higher intent.
Position-Based (U-Shaped) Attribution. Best for: B2B with clear awareness-to-decision journey stages. Typical users: 15% of B2B SaaS, 22% of UK B2B teams. Credit distribution: 40% first touch, 40% last touch, 20% split across middle. Implementation complexity: medium (not natively available in GA4 — requires BigQuery custom calculation). Recommended for: 4 to 8 touchpoint journeys in mid-market SaaS.
W-Shaped Attribution. Best for: complex B2B with distinct consideration milestones. Typical users: 7% of B2B SaaS. Credit distribution: 30% first touch, 30% key middle touchpoint (demo or proposal), 30% last touch, 10% across remaining. Implementation complexity: high (requires CRM integration to identify milestone events). Recommended for: enterprise deals with 10 or more touchpoints and distinct stage gates.
Data-Driven (Algorithmic) Attribution. Best for: organisations with high conversion volume and mature data infrastructure. Typical users: 5% of B2B SaaS, 12% of enterprise. Credit distribution: machine learning assigns credit based on observed conversion patterns. Implementation complexity: low in GA4 (it's the default), but requires 10,000 or more conversions monthly for reliability. Recommended for: high-volume SaaS and e-commerce B2B. Note that 67% of UK mid-market firms report insufficient conversion volume for reliable data-driven attribution.
The Bottom Line: For most UK B2B SaaS teams with 50 to 250 employees, position-based or time-decay models offer the best balance of accuracy and implementability. Start with time-decay (easier to configure in GA4 and HubSpot), run parallel reporting with position-based, and choose whichever generates the most stakeholder buy-in.
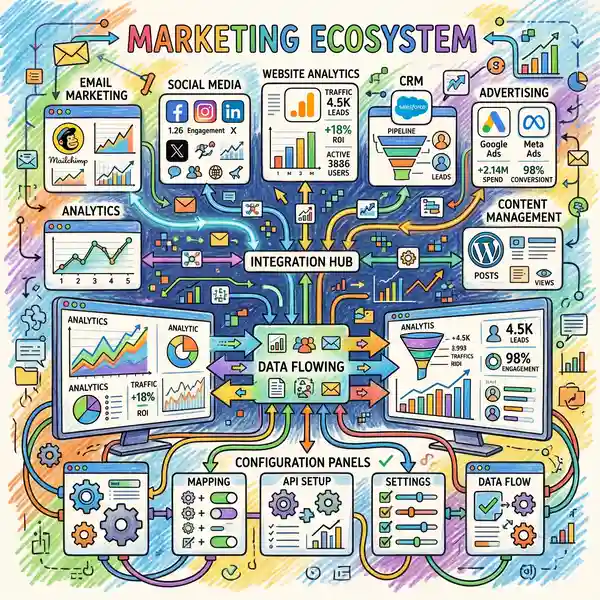
See how a unified marketing stack makes multi-touch attribution possible by connecting every channel to a single source of truth.
Explore Stack UnificationImplementation varies significantly by platform, but the core steps follow a consistent pattern: configure your attribution model, set the right conversion window, integrate your CRM, and establish UTM governance. Here's platform-specific guidance.
Google Analytics 4 (GA4). GA4 switched to data-driven attribution as its default model in January 2024. To change models, navigate to Admin, then Data Display, then Attribution Settings. Available models include data-driven, first-click, last-click, linear, and time-decay. Position-based is not natively available — it requires a BigQuery custom calculation using SQL to assign 40/40/20 credit splits. For B2B, configure your conversion window to 120 to 180 days (the default 90-day window is too short for most mid-market sales cycles). Implement server-side tagging through Google Tag Manager to preserve tracking through cookie deprecation.
HubSpot. HubSpot offers first-touch, last-touch, linear, and time-decay models in Professional editions, with custom attribution available in Enterprise. The key advantage is that HubSpot's first-party data collection — forms, emails, calls, meeting bookings — provides more complete B2B journey visibility than GA4 alone. Configure attribution under Settings, then Objects, then Deals. Set your attribution window to 6 to 12 months for full enterprise sales cycle coverage. Connect GA4 via the Integrations menu to combine web analytics with CRM touchpoints.
Salesforce. Salesforce Einstein Attribution operates at the account and opportunity level, making it ideal for enterprise B2B. It uses machine learning to assign credit to campaigns influencing closed-won accounts. The platform requires high data quality in campaign member associations — 30% to 40% of organisations cite inaccurate associations as a barrier. For Marketo users, Marketo Measure 2.0 integrates with Salesforce to provide ML-based multi-touch attribution, though expect 15% to 25% attribution discrepancy between the two systems due to different matching algorithms.
Critical integration step: Regardless of platform, implement comprehensive UTM parameter governance. Currently 64% of B2B organisations lack a formal UTM policy, per Gartner's 2025 data. Standardise your parameters — utm_source (google, meta, linkedin), utm_medium (cpc, social, email, organic), utm_campaign (quarter-product-audience format) — and enforce them through marketing approval gates before campaign launch.
Attribution implementation fails more often from avoidable mistakes than from model selection. These are the five errors that cost UK B2B teams the most budget, based on research from Forrester, Gartner, and Demand Gen Report.
Mistake 1: Using a 30-day attribution window for long sales cycles. 73% of B2B organisations use 30-day attribution windows regardless of actual sales cycle length. For a mid-market SaaS deal spanning 12 to 20 weeks, this means every touchpoint older than 30 days receives zero credit — systematically erasing the awareness and consideration activities that created the opportunity. Fix: audit your actual sales cycle lengths by segment in your CRM, then set differentiated windows. SMB self-serve: 30 days. Sales-assisted SMB: 60 days. Mid-market: 120 days. Enterprise: 180 days.
Mistake 2: Ignoring offline touchpoints. 71% of B2B organisations cannot track offline-to-online journeys. Trade shows, phone calls, in-person meetings, and sales negotiations represent 7% to 12% of buyer journey touchpoints — and for enterprise deals, sales calls account for 18% to 25% of decision-stage influence. Fix: implement CRM-based offline touchpoint logging. Train your sales team to log every interaction (aim for 60% to 70% compliance initially). Post-process offline and online data in a combined attribution report.
Mistake 3: Not connecting GA4 to your CRM. Without CRM integration, GA4 cannot match user sessions to actual pipeline outcomes. You'll see "direct traffic" conversions that are actually the final step of a 10-touchpoint journey. Fix: implement GA4 User ID matching to your HubSpot Contact ID or Salesforce record. Configure data import for 24-hour sync. This single integration recovers 20% to 30% of previously unattributed touchpoints.
Mistake 4: Treating all deal sizes with the same model. A self-serve free trial and a £100K enterprise contract don't follow the same buyer journey. Using one attribution model for both produces meaningless averages. Fix: segment your attribution by deal size and buyer type. Run separate models for SMB (simple, short window) and enterprise (complex, long window) segments.
Mistake 5: Expecting perfect data before starting. Attribution is inherently imperfect. No model captures 100% of buyer influence. The goal is "better than last-click," not "perfect." Companies that combine attribution with content strategy measurement frameworks and sales alignment initiatives achieve 18% to 28% CAC improvements — attribution alone accounts for roughly 40% of that gain.
Warning — The Cost of Getting It Wrong: Budget misallocation from poor attribution costs £10,000 to £50,000 or more annually per £1M in marketing spend, per Demand Gen Report. That's not a rounding error — it's an entire campaign's worth of spend directed at the wrong channels every year.
Here's a 20-week implementation roadmap for a UK mid-market B2B SaaS team, based on industry benchmarks from Forrester and HubSpot's 2025 implementation data.
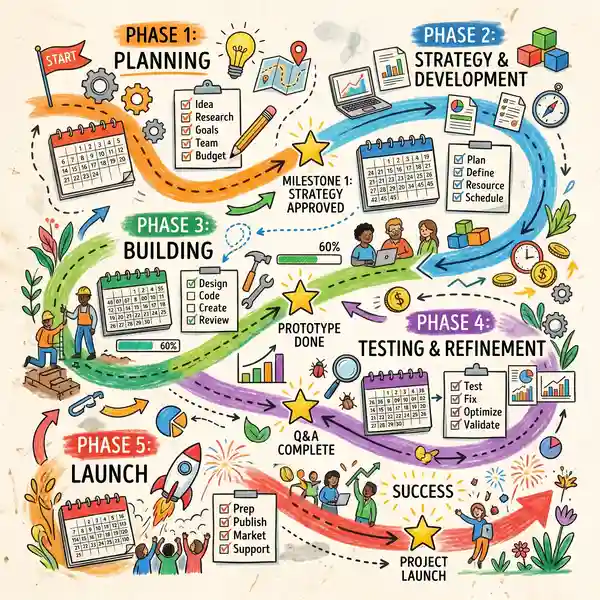
Phase 1: Discovery and Planning (Weeks 1 to 3). Interview stakeholders across marketing, sales, and finance to define what "good attribution" means for your organisation. Audit your current tech stack and map every data source. Analyse actual sales cycle lengths by segment from your CRM — this determines your attribution windows. Output: requirements document, martech inventory, and sales cycle analysis.
Phase 2: Model Selection and Design (Weeks 4 to 6). Choose your primary attribution model based on this guide's comparison framework. For most UK mid-market B2B SaaS teams, start with time-decay (available in GA4 and HubSpot) and run position-based in parallel via BigQuery or Excel. Design your data architecture — which systems need to connect and how. Output: model recommendation, data integration plan, and stakeholder communication strategy.
Phase 3: Build and Configure (Weeks 7 to 14). Configure GA4 attribution settings and conversion windows. Build CRM integration pipelines connecting HubSpot or Salesforce to GA4. Develop attribution calculation logic in SQL or Excel. Create stakeholder dashboards and reports. This is the longest phase — plan for 8 weeks including inevitable data quality troubleshooting.
Phase 4: Testing and Validation (Weeks 15 to 17). Run variance analysis comparing your new model's output against last-touch. Reconcile GA4 data with CRM records. Get stakeholder feedback and fine-tune parameters. Document operating procedures and troubleshooting guides.
Phase 5: Launch and Training (Weeks 18 to 20). Train your team on reading attribution reports. Present budget allocation recommendations to leadership. Establish quarterly review cycles for model parameter adjustment. Plan for 4 hours per week of ongoing maintenance.
Resource estimate: A typical implementation requires roughly 1,024 total hours across a project lead (300 hours), data engineer (240 hours), analytics engineer (240 hours), BI analyst (144 hours), and stakeholder time (100 hours). For teams without in-house data engineering, platforms like Marketing Mary's automated pipeline can unify data sources and simplify the integration layer, reducing implementation from 20 weeks to as few as 8.
For most B2B SaaS teams with 50 to 250 employees, position-based (U-shaped) or time-decay attribution models offer the best balance of accuracy and ease of implementation. Position-based gives 40% credit to first and last touches with 20% spread across the middle, while time-decay weights recent interactions more heavily. Start with time-decay in GA4 or HubSpot, then run position-based in parallel to compare results.
SMB buyers (50 to 250 employees) average 5.2 touchpoints over 6 to 12 weeks. Mid-market buyers (250 to 1,000 employees) average 7.8 touchpoints over 12 to 20 weeks. Enterprise buyers average 10.4 touchpoints over 16 to 32 weeks. These numbers make single-touch attribution fundamentally inadequate for any B2B organisation with sales cycles exceeding one month.
As of January 2024, Google Analytics 4 uses data-driven attribution (DDA) as its default model. DDA uses machine learning to analyse historical conversion data and assign credit based on observed influence patterns. However, it requires approximately 10,000 conversions per month for reliable results — most B2B organisations lack this volume and should switch to time-decay or configure position-based via BigQuery.
A full multi-touch attribution implementation typically takes 16 to 24 weeks, including discovery and planning (3 weeks), model design (3 weeks), platform configuration and CRM integration (8 weeks), testing and validation (3 weeks), and launch with training (3 weeks). UK implementations average 18.2 weeks — slightly longer than the global average of 16.4 weeks due to smaller team sizes and GDPR considerations.
Cookie deprecation is expected to cause 20% to 35% decline in attribution accuracy across B2B organisations, with cross-domain attribution losing roughly 60% accuracy and retargeting attribution losing up to 80%. The mitigation strategy is to shift to first-party data collection through server-side tagging, authenticated user tracking, and CRM-first attribution models. B2B teams using email-based deterministic matching can maintain 60% to 75% journey tracking accuracy post-deprecation.
Organisations implementing multi-touch attribution report average marketing ROI improvements of 18%, lead quality improvements of 22%, sales cycle acceleration of 13%, and CAC reductions of 15%, according to Forrester and McKinsey research. Companies combining attribution with sales and marketing alignment initiatives achieve the highest gains — up to 28% CAC reduction over 18 months.
Ready to See Which Channels Actually Drive Your Revenue?
Marketing Mary's AI Co-Pilot unifies your marketing stack into a single source of truth — connecting every touchpoint so you can finally measure what matters.
Clwyd Probert
Founder, Marketing Mary
Clwyd Probert is the founder of Marketing Mary, an AI-powered marketing co-pilot platform, and CEO of Whitehat, a London-based SEO and inbound marketing agency and HubSpot Platinum Partner since 2016.
Sources: Gartner UK Digital Marketing Survey 2025, Forrester Wave: Digital Analytics Platforms 2024, Demand Gen Report 2024-2025, McKinsey Digital Marketing Analysis 2024, Google Analytics 4 Documentation 2024, HubSpot Marketing Benchmarks 2025

The Marketing Co-Pilot Operating Model is a three-stage framework for running AI-assisted marketing: Scan (research, listening and persona intake),...
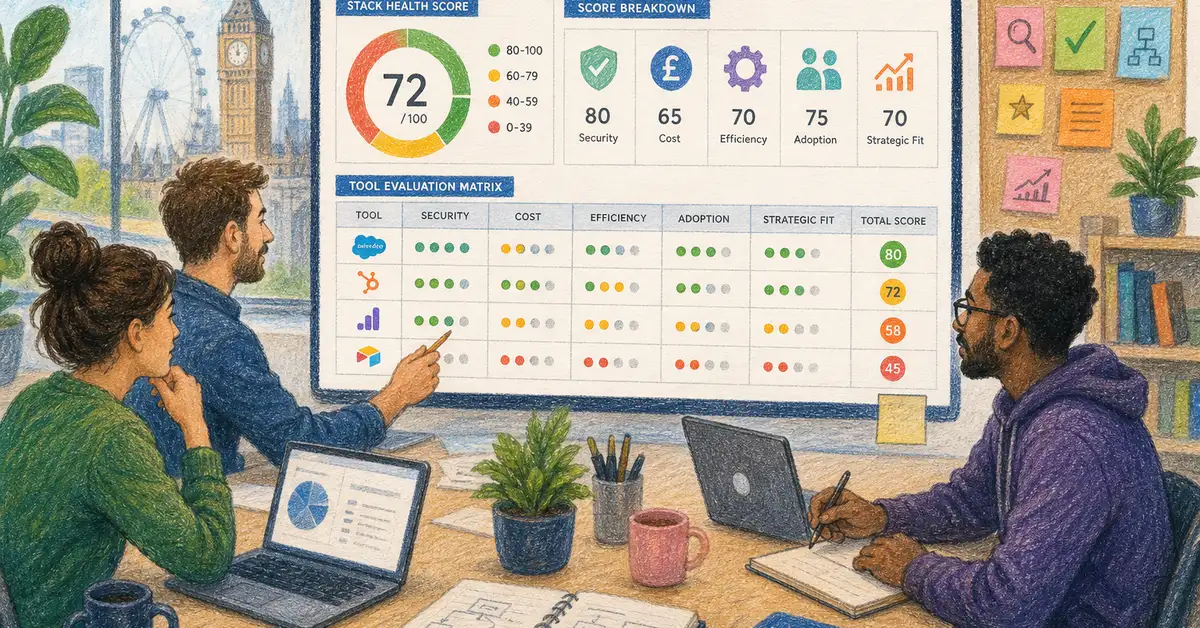
How to Run a MarTech Stack Audit: Framework, Scoring Template, and ROI Calculator A MarTech stack audit systematically evaluates every marketing...

A buyer persona tool is software that builds, stores, and operationalises research-based profiles of your ideal customers — the goals, pains, and...
1 min read
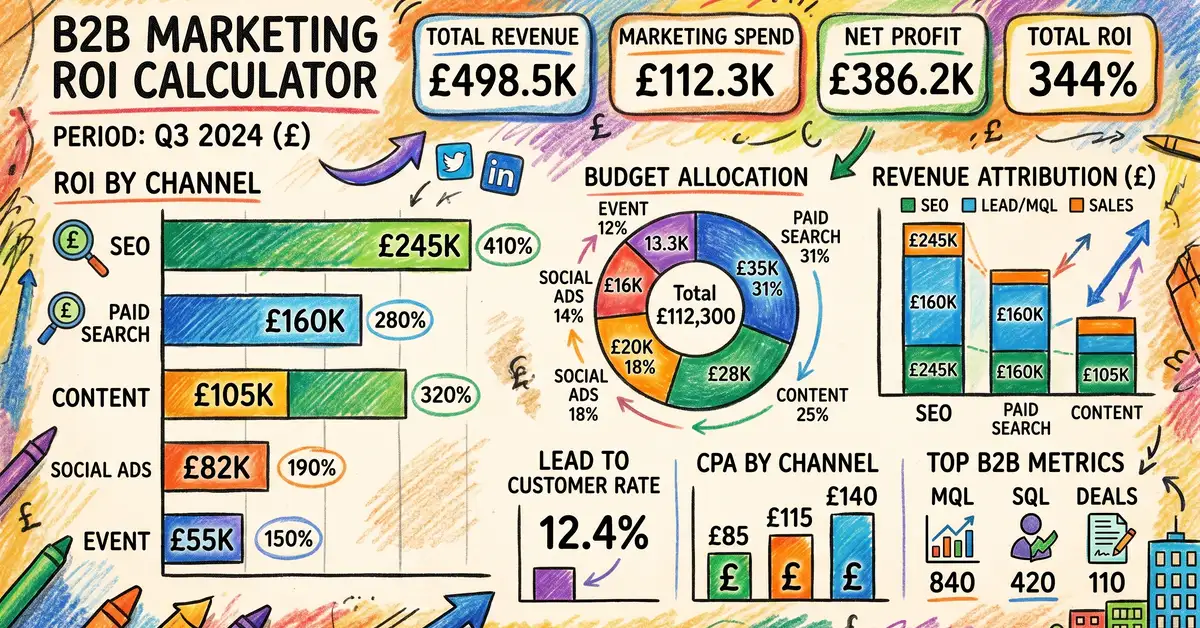
A marketing ROI calculator takes your channel spend, revenue generated, and associated costs — then outputs the true return percentage, cost per...

1 min read
Why You Need a Marketing Plan Template A marketing plan template gives your team a proven structure that turns scattered ideas into a focused,...

1 min read
Key Takeaway The AI marketing tool market has exploded to 15,384 solutions, yet most UK SME teams need just 3–5 well-chosen tools — not twelve. The...