 Clwyd Probert
The Marketing Co-Pilot Operating Model: Scan, Co-Pilot, Scale
The Marketing Co-Pilot Operating Model is a three-stage framework for running AI-assisted marketing: Scan (research, listening and persona intake),...
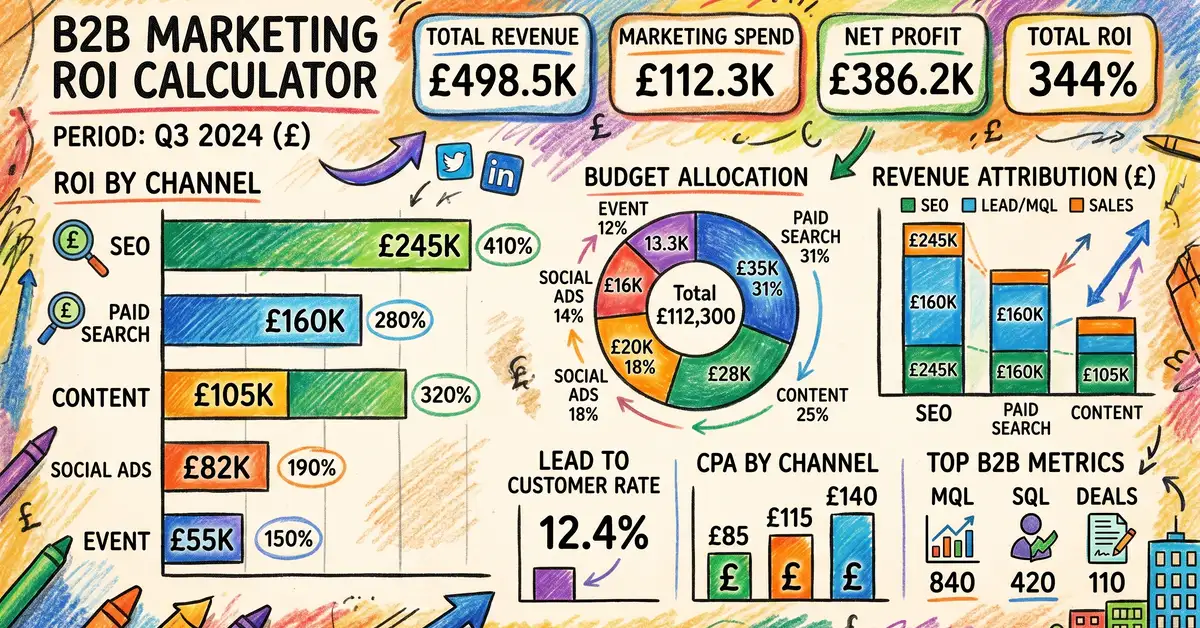
A marketing ROI calculator takes your channel spend, revenue generated, and associated costs — then outputs the true return percentage, cost per acquisition, and payback period so you can justify budgets and reallocate spend to your highest-performing channels. Only 42% of B2B marketing leaders can accurately trace revenue to marketing activities, which means most teams are making budget decisions with incomplete data.
The numbers tell a stark story: email marketing returns £42 per every £1 spent (the highest-returning channel for B2B teams), yet 34% of marketing spend goes completely untracked. Attribution window errors alone shrink reported ROI by 23–31%. This guide walks you through the formulas, benchmarks, and common mistakes — plus a free Excel workbook you can use to calculate ROI across every channel.
The standard marketing ROI formula is straightforward: (Revenue Attributed to Marketing minus Marketing Cost) divided by Marketing Cost times 100. But this base formula hides a critical problem — it assumes all revenue is incremental and ignores baseline performance. Most marketers overstate ROI by 15–40% using this method without accounting for organic, non-marketing revenue drivers.
The bigger issue is channel-specific measurement. Email marketing requires 45–90 day attribution windows for B2B decisions, not the 28-day platform default. Content marketing needs 12+ month measurement windows minimum. Paid search clicks in B2B may not convert for 60–120 days. Using the wrong timeframe for each channel systematically distorts your ROI picture — and 61% of B2B SMEs still use last-click attribution only, which gives 100% credit to the final touchpoint and ignores all preceding interactions.
Key Takeaway: The standard ROI formula tells you what happened, but not what is actually driving revenue. To get accurate marketing ROI, you need channel-appropriate attribution windows (45–120 days for B2B), multi-touch attribution models, and customer lifetime value adjustments. Without these, you are likely underestimating your best channels by 23–31% and overestimating your worst ones.
Every channel needs a different ROI calculation because the cost structure, attribution window, and revenue pattern differ significantly. Here are the formulas that actually work for B2B teams.
Formula: (Email Revenue minus Platform, Content, and Staff Costs) divided by Total Cost times 100. Attribution window: 45–90 days for B2B. Common mistake: Using the 28-day default undervalues email ROI by 28–35%.
Formula: (Organic Traffic times Conversion Rate times Deal Value minus Content Cost) divided by Cost times 100. Attribution window: 12+ months minimum. Common mistake: Measuring in under 6 months shows negative ROI for a channel that delivers £5–£7 per £1 long-term.
Formula: (Conversion Value minus Ad Spend minus Tool Costs) divided by Total Spend times 100. Attribution window: 60–120 days for B2B. Common mistake: Google's reporting inflates ROI by 12–18% via last-click bias.
Formula: (Attributed Revenue minus Ad Spend minus Creative Costs) divided by Total Spend times 100. Attribution window: 60–120+ days. Common mistake: LinkedIn reports lead ROI, not customer ROI — true ROI is 40–60% lower.
Formula: (Attendees times Conversion Rate times Deal Value minus Total Event Cost) divided by Cost times 100. Attribution window: 90–180 days. Common mistake: 73% of event marketers exclude marketing promotion costs from calculations.
The critical adjustment most teams miss is customer lifetime value (CLV). A campaign showing 400% ROI from initial revenue jumps to 938% when you include 3-year retention value — yet only 21% of B2B SMEs calculate CLV-adjusted ROI. For retention-driving campaigns like email nurture sequences, ignoring CLV makes your best channels look mediocre and your worst channels look acceptable.
Our Excel workbook includes pre-built formulas for every channel — email, content, paid search, social, and events. It calculates standard ROI, CLV-adjusted ROI, cost per acquisition, and return per £1 spent automatically. Includes 3 scenario models, a channel comparison dashboard, CLV calculator, and attribution window guide.
Download Free Marketing ROI Workbook (ZIP)
Want AI to track your marketing ROI automatically? See how Marketing Mary's AI agent connects your entire stack into a single ROI dashboard.
The accuracy of your ROI calculation is only as good as the data feeding it. Here is what you need from each channel and where to find it.
Step 1: Connect Your CRM to Every Channel — Your CRM (HubSpot, Salesforce) is the single source of truth for customer-level revenue attribution. Without CRM integration, you are measuring leads, not revenue. 58% of B2B SMEs cannot trace a lead from first touch to customer because their CRM is not connected to their marketing tools. Start here — connect your email platform, ad accounts, and analytics to your CRM before attempting any ROI calculation.
Step 2: Set Channel-Appropriate Attribution Windows — Override platform defaults immediately. Set email attribution to 45–90 days, paid search to 60–120 days, content to 12+ months, and events to 90–180 days. The B2B average sales cycle is 45–90 days for SMEs — using 30-day windows systematically undercounts your ROI by 23–31%. In GA4, configure custom attribution windows under Admin then Attribution Settings.
Step 3: Capture Full Cost Data (Not Just Ad Spend) — Most teams undercount costs, which inflates ROI. Include platform fees (email tools, SEO tools, CRM), content creation costs (writers, designers), staff time (hourly rate times hours spent), and distribution costs. For events, include the marketing promotion budget — 73% of event marketers exclude this, causing true costs to be 40–60% higher than reported.
Step 4: Switch to Multi-Touch Attribution — B2B customers touch your brand 8–12 times before purchasing. Last-click attribution gives 100% credit to the final touchpoint and nothing to the content, emails, and events that built the relationship. Use a position-based model (40-20-40): 40% credit to first touch, 20% to middle interactions, 40% to the converting touch. This prevents content marketing being undervalued by 50–70%.
Step 5: Build a Monthly ROI Dashboard — Create a single view that shows ROI by channel, updated monthly. Include spend, revenue attributed, CPA, and return per £1 — with trailing 3-month and 12-month windows. 68% of marketing dashboards lead with vanity metrics (traffic, followers, impressions) instead of revenue-influenced metrics. Your dashboard should answer one question: "For every £1 we spent on each channel, how much revenue did we generate?"
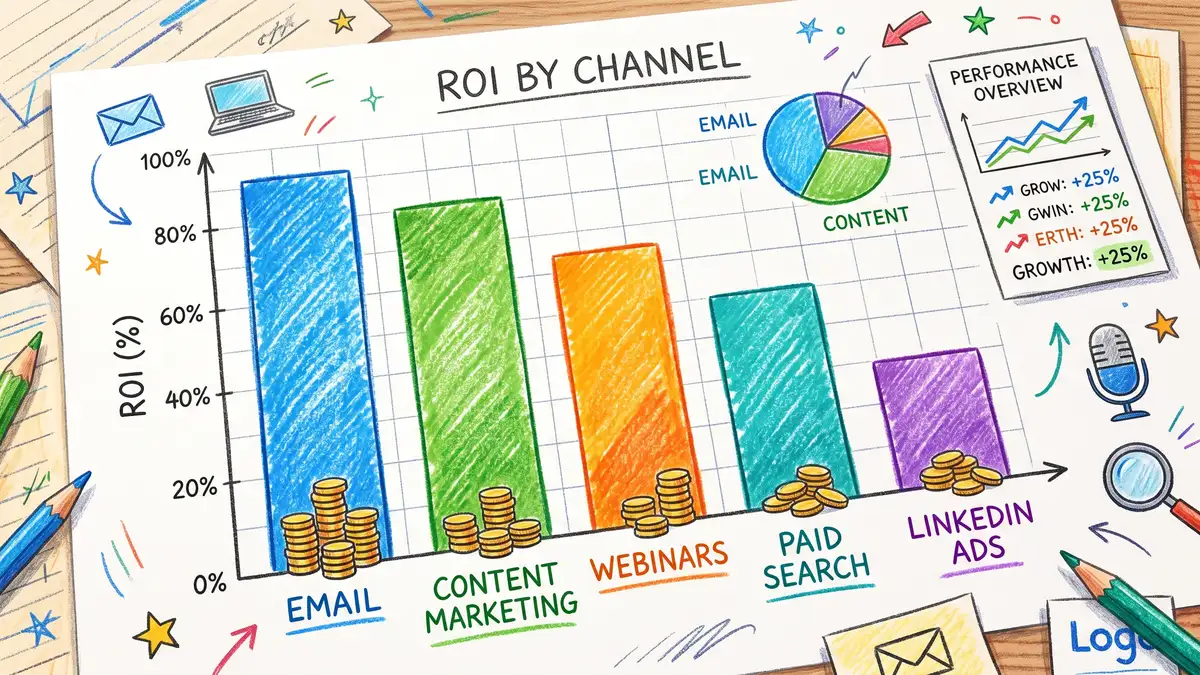
Not all marketing channels are created equal — and the gap between the best and worst performing channels is enormous. Here is how B2B channel ROI compares based on 2025–2026 industry benchmarks.
ROI per £1: £42–£49. Payback period: 2–4 weeks. B2B CPL: £5–£15. Best for: Retention, nurture sequences, existing customer upsell.
ROI per £1: £5–£7 in year 1, £12–£18 over 3 years. Payback period: 6–12 months. B2B CPL: £15–£50. Best for: Compounding organic traffic, thought leadership, brand authority.
ROI per £1: £4–£9. Payback period: 3–6 months. B2B CPL: £25–£75. Best for: Lead qualification, product demos, relationship building.
ROI per £1: £2.50–£4. Payback period: 2–8 weeks. B2B CPL: £25–£65. Best for: High-intent capture, fast testing, immediate visibility.
ROI per £1: £1.50–£3.50. Payback period: 2–4 months. B2B CPL: £35–£85. Best for: B2B targeting, account-based marketing, decision-maker reach.
ROI per £1: £3–£6.50. Payback period: 3–6 months. B2B CPL: £80–£150. Best for: Relationship building, pipeline acceleration, sales cycle shortening.
The standout insight: email marketing delivers £42–£49 per every £1 spent, making it the highest-ROI channel by a wide margin. Yet many B2B teams underinvest in email and over-allocate to paid social — which delivers only £1.50–£3.50 per £1 at the lead generation level. If your budget split does not reflect these benchmarks, you are likely leaving significant returns on the table.
Content marketing tells an interesting story too. First-year ROI looks modest at £5–£7 per £1, which is why teams with short measurement windows kill content programmes prematurely. But the 3-year cumulative ROI of £12–£18 per £1 makes it the second-highest returning channel long-term — content compounds in a way that paid channels never will.
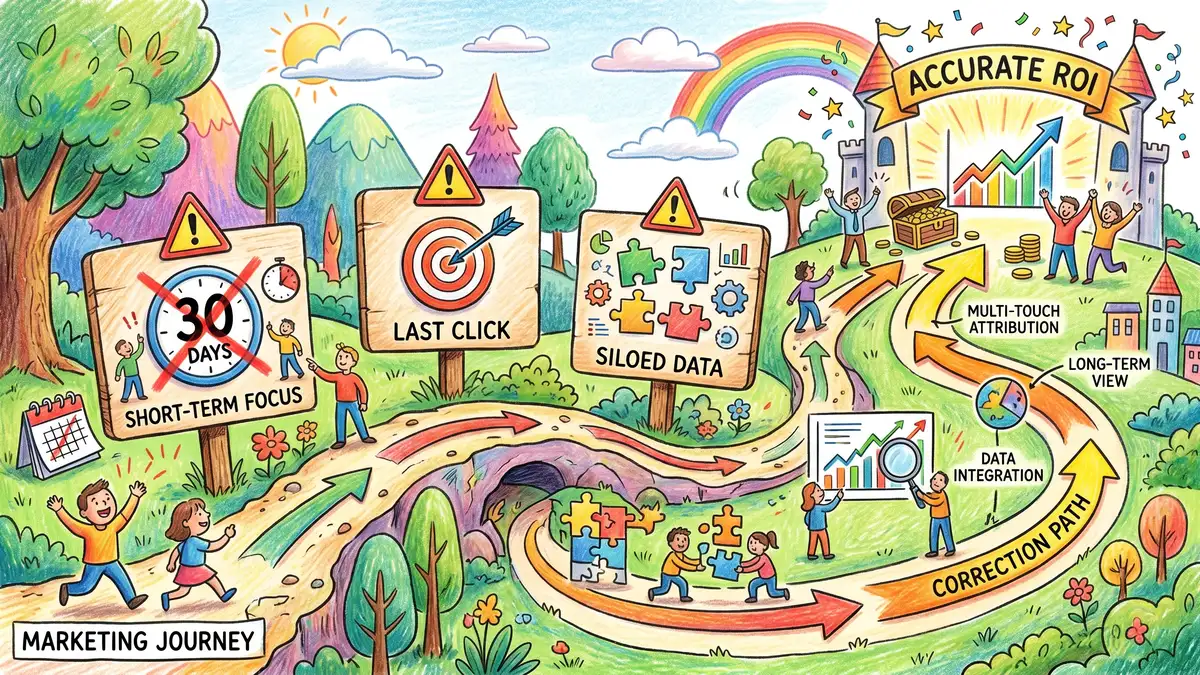
Warning — The Attribution Window Trap: The most expensive ROI mistake is using platform-default 28–30 day attribution windows for B2B campaigns. Average B2B sales cycles run 45–90 days (SME) to 120–180+ days (enterprise). This means 23–31% of your true ROI is invisible — and you are making budget decisions based on incomplete data. The fix: Set email to 45–90 days, paid search to 60–120 days, content to 12+ months, and events to 90–180 days. In GA4, go to Admin then Attribution Settings and configure custom lookback windows that match your actual sales cycle length.
Beyond attribution windows, here are the mistakes that silently destroy ROI accuracy for B2B teams:
Last-Click Attribution Bias — Last-click gives 100% credit to the final touchpoint, ignoring the 8–12 touches that built the relationship. Content marketing loses 50–70% of its credit, while retargeting ads get inflated credit. Switch to position-based (40-20-40) attribution to see the full picture.
Vanity Metrics as ROI Proxies — 68% of marketing dashboards lead with traffic, followers, and impressions instead of revenue-influenced metrics. These numbers feel good but tell you nothing about business impact. If a metric doubling would not double revenue, it is a vanity metric — replace it with pipeline contribution or customer acquisition cost.
Double-Counting Revenue — 34% of B2B SMEs assign the same revenue to multiple channels — email claims £100K, paid search claims the same £100K, total reported is £200K from £100K actual revenue. Use credit-splitting models where each customer's revenue is divided across touchpoints, never duplicated.
Ignoring Opportunity Cost — 71% of B2B SMEs optimise channels in isolation without comparing alternatives. A 400% ROI on paid search sounds great — until you realise the same budget in email would deliver 4,100% ROI. Always compare channel ROI against each other, not just against zero.
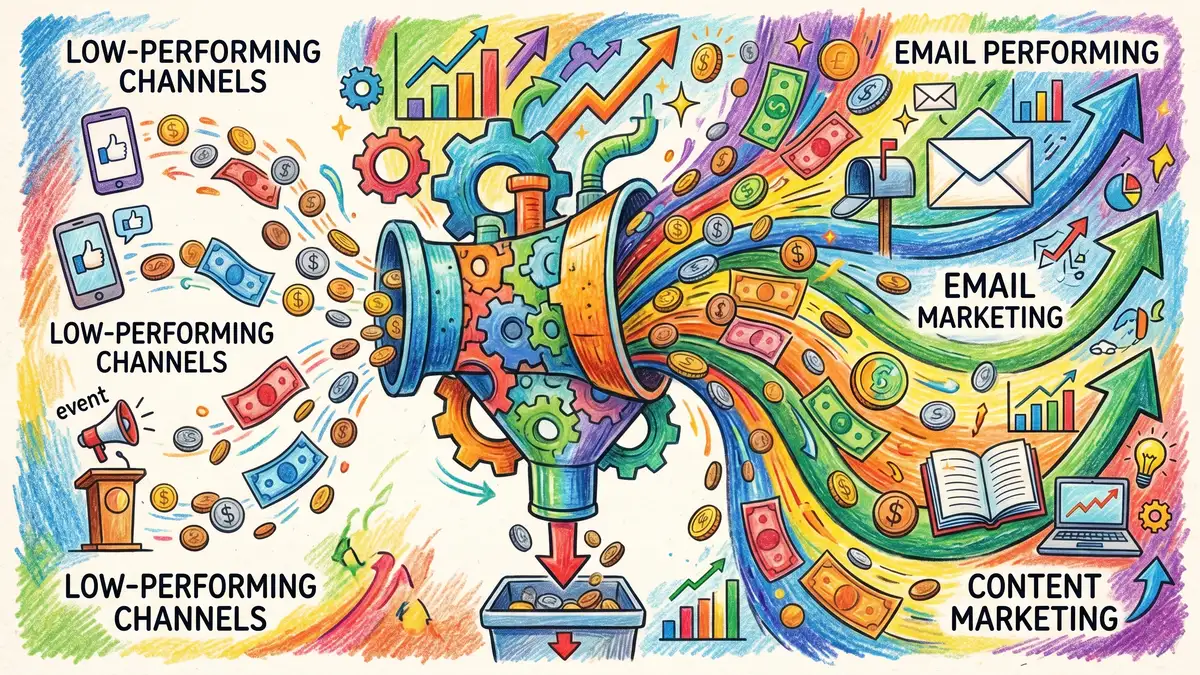
Calculating ROI is pointless if you do not act on it. The goal is not a report — it is better budget allocation. Here is how to translate ROI data into spending decisions that actually improve results.
Step 1: Rank channels by ROI per £1 spent. Your ROI calculator output gives you this directly. Sort from highest to lowest return — this is your investment priority list. For most B2B teams, this ranking will show email and content dramatically outperforming paid social and events on a per-pound basis.
Step 2: Apply the diminishing returns principle. Every channel hits a point where additional spend produces lower marginal ROI. Email might deliver £42 per £1 at £5K/month but only £25 per £1 at £15K/month (list fatigue, reduced engagement). Track ROI at different spend levels over 3–6 months to find each channel's optimal investment zone.
Step 3: Use a portfolio approach. Do not dump everything into your highest-ROI channel. Maintain a 60-20-20 split: 60% in proven high-ROI channels (email, content), 20% in growth channels (paid search for new keyword capture), and 20% in experimental channels (new platforms, formats, partnerships). This protects against channel dependency and discovers new opportunities.
Step 4: Set kill criteria before launching. Define in advance what ROI threshold triggers a budget cut. If LinkedIn ads must deliver £2+ per £1 by month 3 to continue, write it down before campaign launch. Marketing automation makes this easier by tracking ROI continuously rather than waiting for quarterly reviews.
The teams that gain the most from ROI measurement are those with unified marketing stacks — marketers using integrated data see 67% better ROI tracking accuracy compared to those with siloed tools. When your CRM, email platform, analytics, and ad accounts share data, multi-touch attribution becomes possible without manual spreadsheet reconciliation.
A healthy B2B marketing ROI varies significantly by channel. Email marketing benchmarks at £42–£49 per £1 spent, content marketing delivers £5–£7 per £1 in year one (rising to £12–£18 over three years), and paid search returns £2.50–£4 per £1. Overall, if your blended marketing ROI exceeds 500% (£5 return per £1 spent across all channels), you are performing above the B2B median.
The standard formula is (Revenue Attributed to Marketing minus Marketing Cost) divided by Marketing Cost times 100. For accurate B2B measurement, use channel-appropriate attribution windows (45–120 days instead of 30-day defaults), include all costs (platform fees, staff time, content creation — not just ad spend), and apply multi-touch attribution models so revenue credit is shared across all touchpoints rather than assigned entirely to the last click.
The three most common causes: using 28–30 day attribution windows when your sales cycle is 45–90+ days (underestimates ROI by 23–31%), relying on last-click attribution which ignores all but the final touchpoint, and siloed data that prevents tracing leads from first touch to customer. Only 42% of B2B leaders can accurately connect revenue to marketing activities.
Minimum 12 months for content marketing and SEO. Content ROI is negative in months 1–6 for most programmes (creation cost exceeds revenue), breaks even around months 6–12, and compounds from there. The 3-year cumulative ROI of £12–£18 per £1 makes content the second-highest returning channel long-term, but only if you measure over an appropriate timeframe.
ROAS (Return on Ad Spend) measures revenue per £1 of ad spend only — it excludes staff costs, tool costs, content creation, and other overheads. ROI measures total return against total investment. A campaign with 500% ROAS might have only 200% ROI once you include the full cost base. Always use ROI for strategic budget decisions; ROAS is useful for optimising within a single paid channel but misleading for cross-channel comparisons.
CFOs respond to three things: revenue attribution (which marketing activities generated how much revenue), payback period (how long until marketing spend is recouped), and CAC-to-LTV ratio (does the cost of acquiring customers make financial sense given their lifetime value). Present a monthly ROI dashboard showing spend by channel, revenue attributed, CPA, and return per £1 — with trailing 3-month windows for accuracy.
Marketing Mary connects your entire marketing stack into a single ROI dashboard — so you can see exactly which channels drive revenue, which waste budget, and where to reallocate for maximum return.
Join 500+ Marketing Leaders on the Waitlist | Book a personalised demo
Sources: HubSpot State of Marketing 2025, DMA UK Email Benchmarks 2025, Forrester B2B Content ROI Study 2025, Semrush 2025, Econsultancy 2025, Adverity 2025, Gartner 2025, ON24 2025
Clwyd Probert — Founder, Marketing Mary. Clwyd builds AI-powered marketing tools that help SME teams escape the content treadmill.

The Marketing Co-Pilot Operating Model is a three-stage framework for running AI-assisted marketing: Scan (research, listening and persona intake),...
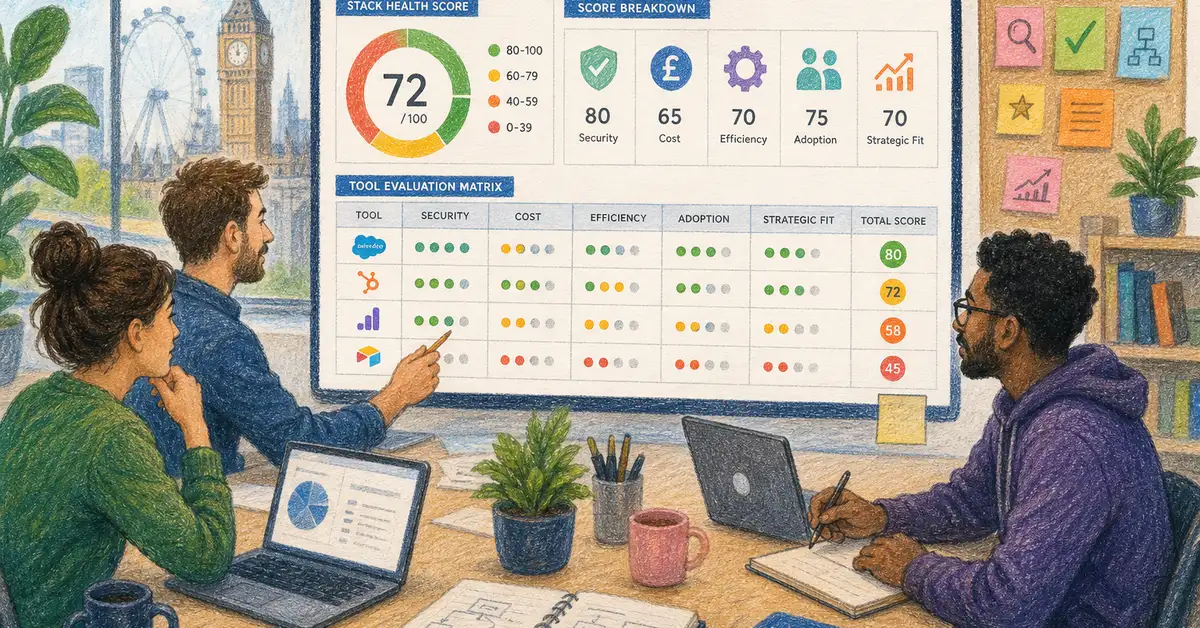
How to Run a MarTech Stack Audit: Framework, Scoring Template, and ROI Calculator A MarTech stack audit systematically evaluates every marketing...

A buyer persona tool is software that builds, stores, and operationalises research-based profiles of your ideal customers — the goals, pains, and...
1 min read
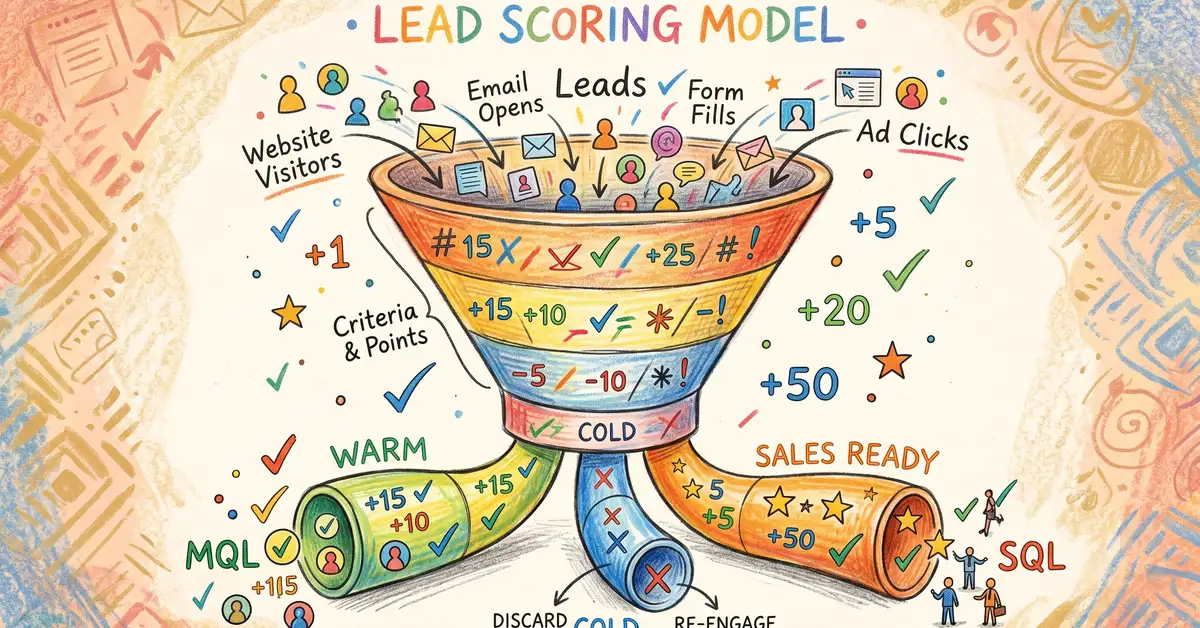
Organisations that implement structured lead scoring see 77% higher lead generation ROI than those that do not score leads. Yet most B2B teams still...

14 min read
Contents 1. The Importance of Skepticism, Transparency, and Accountability in AI Development2. Balancing the Benefits and Risks of AI Language...

15 min read
Contents 1. The Transformative Potential of Artificial Intelligence2. AI Models: Surprising Capabilities and Applications3. The Role of AI in...